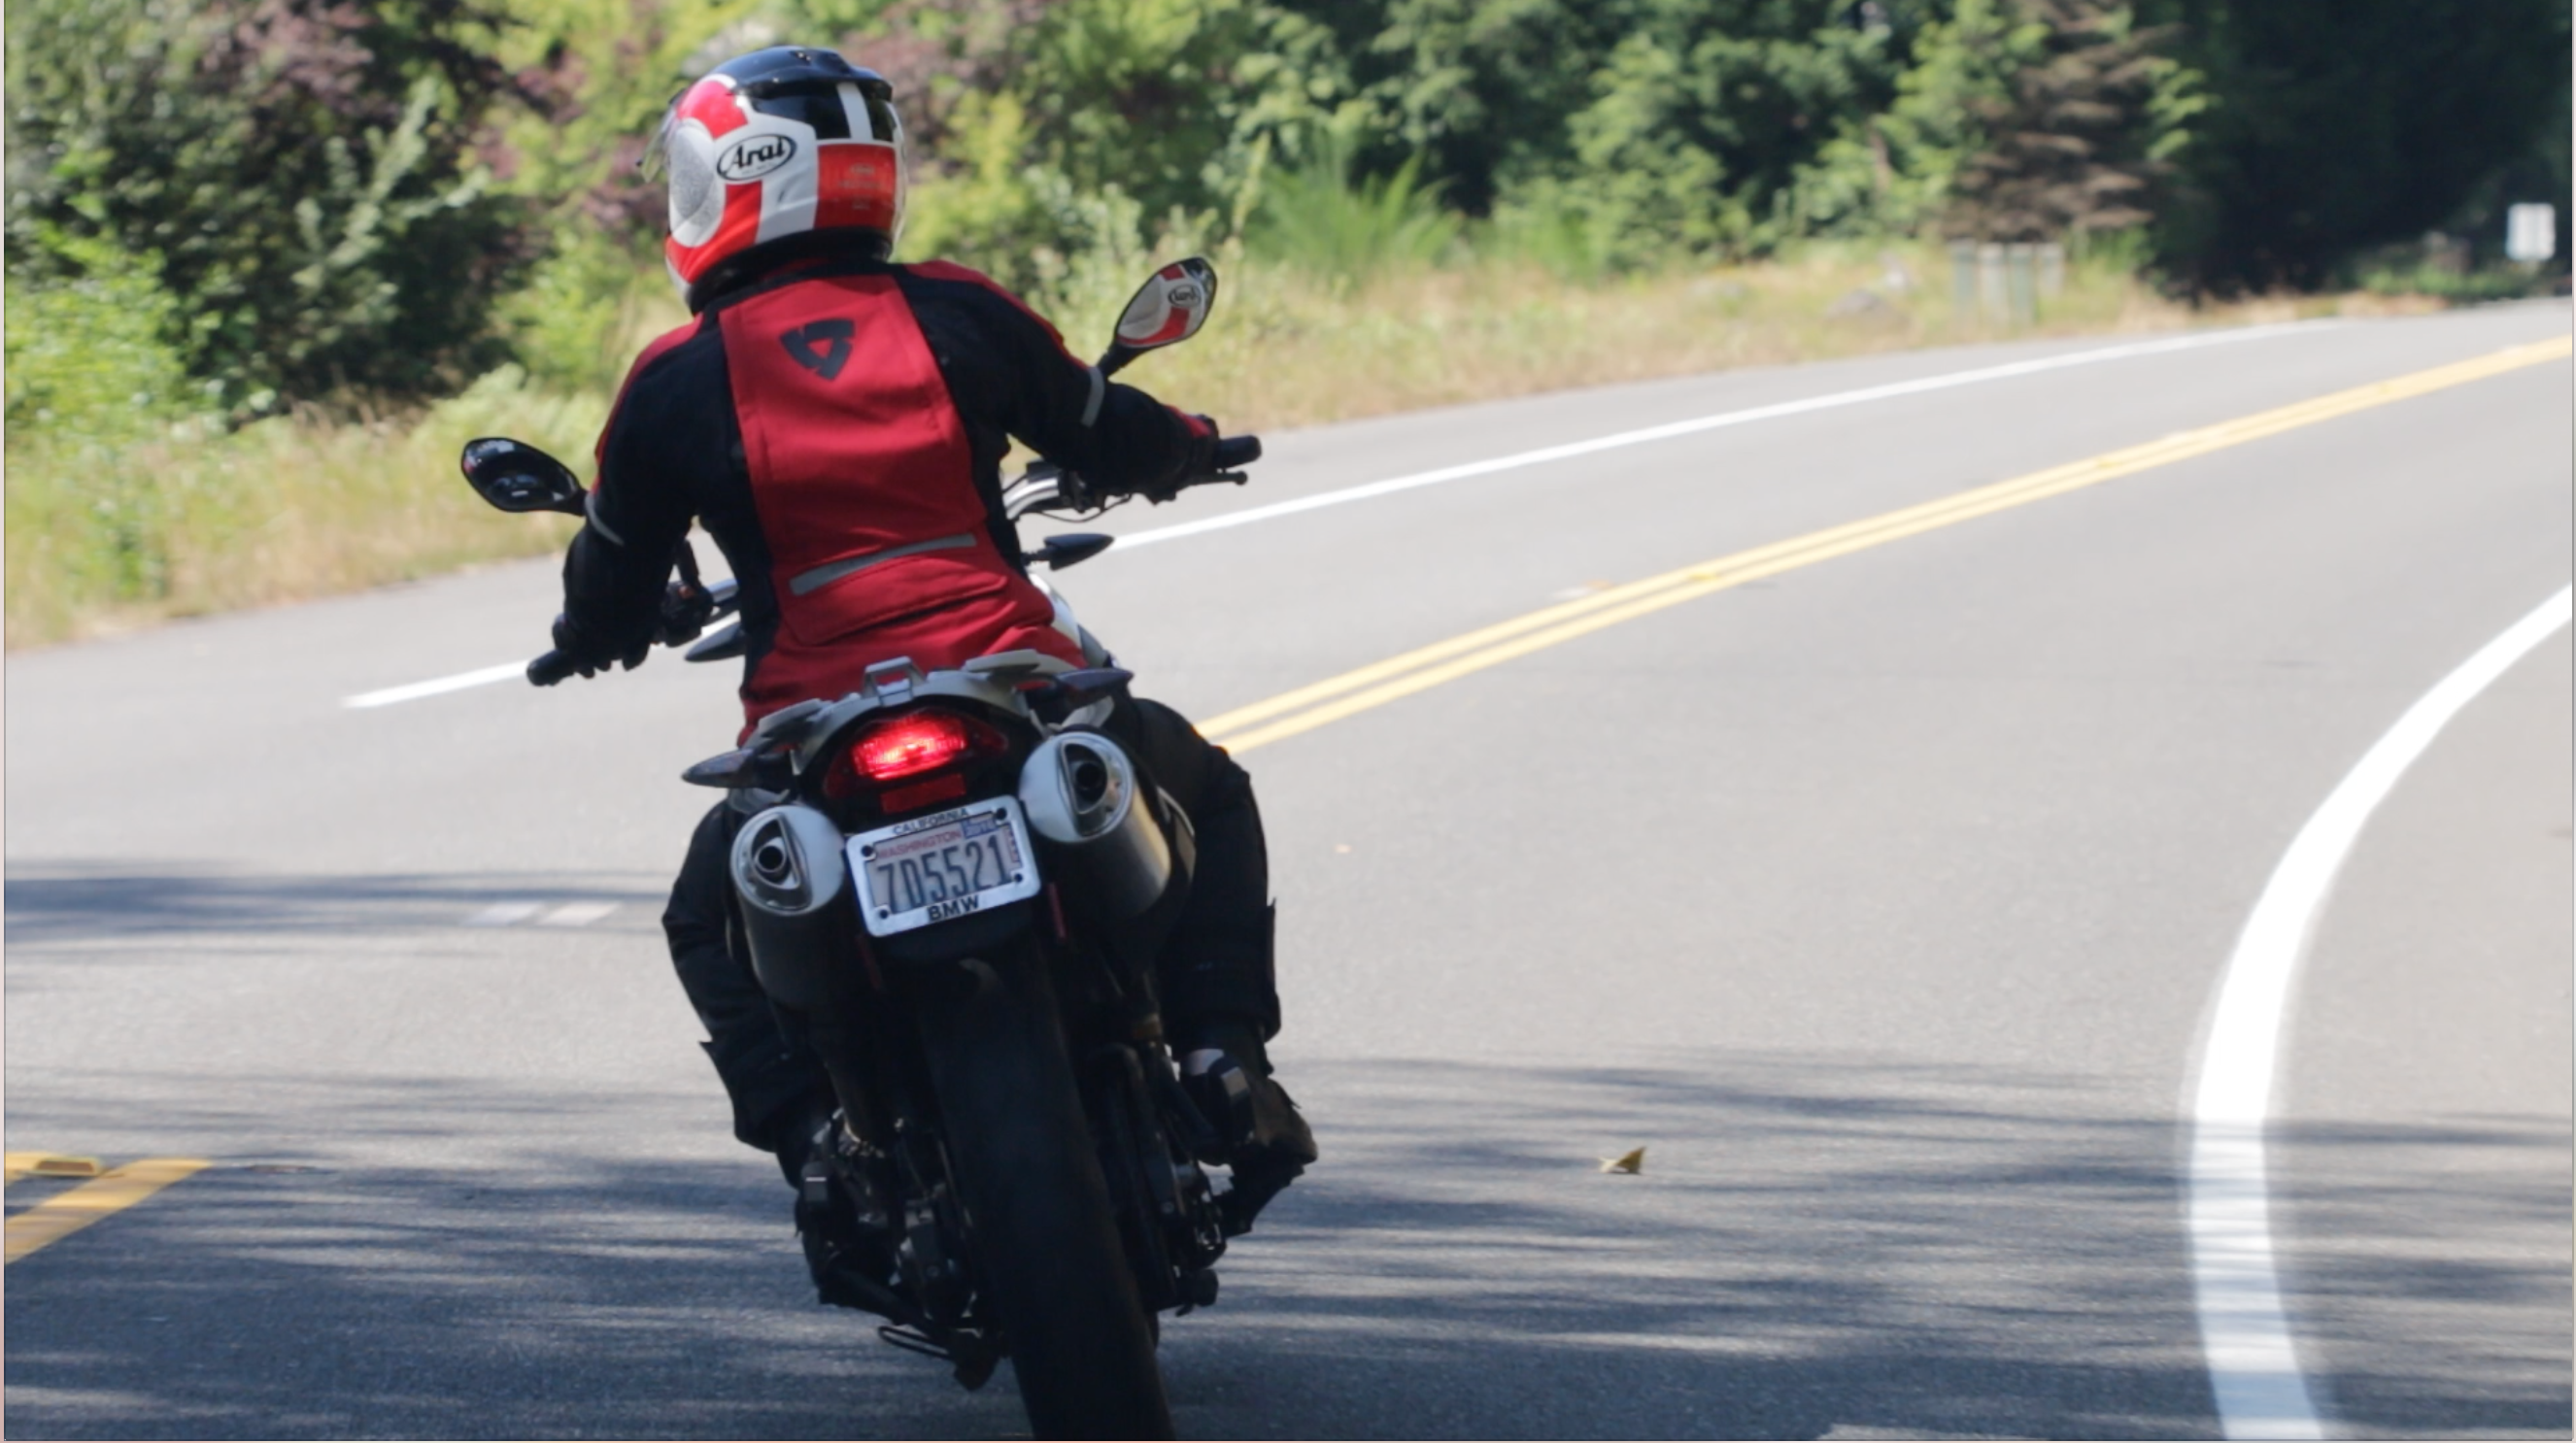
Few things compare to the experience of riding. From the feel of the bike beneath your body, to the way the tires grab the road as you round into a curve, nothing compares to the visceral immersion with the environment as the wind blows past your body. Yet, any feelings of exuberance and liberation aside, motorcyclists find themselves in dangerous and even life-threatening situations on a daily basis.
Skry is the first advanced awareness and hazard reporting system for motorcyclists. This system leverages map, weather, and traffic data, as well as crowdsourced feedback from other riders, to alert a ride of what's up ahead on their route. With the user of voice UI and HUD, the rider is forewarned of impending events, without taking their eyes off the road or their hands off the controls.
Although motorcyclists account for just 3% of the vehicles registered, they make up 14% of all traffic fatalities (NTSA, 2015). In fact, if a motorcyclist is in a traffic accident they are 26 times more likely to die than if they were in a car. Given those statistics, motorcycling is one of the most dangerous methods of transportation in the world.
To date, no technology exists to specifically support the rider in providing increased situational awareness about what is ahead on their route. As such, the target user for this study were motorcyclists who use navigation while riding.
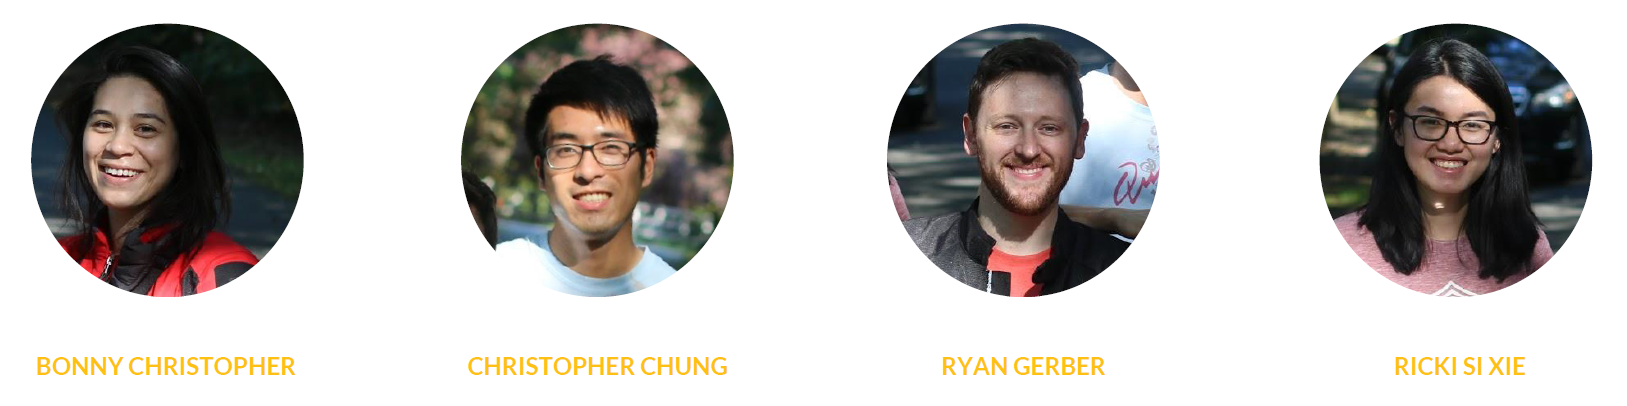
I was part of a team of 4 for this project, and was responsible for leading the prototyping and user testing efforts. Bonny Christopher was in charge of the user research, while Ryan Gerber served as the PM for the project. Finally, Ricki Xie was in charge of the visual design.
We also had additional support from two sponsors for our project: Ustwo and Tactile, who provided their expertise in the automotive space as well as their experience translating creative ideas and engineering solutions into compelling products.
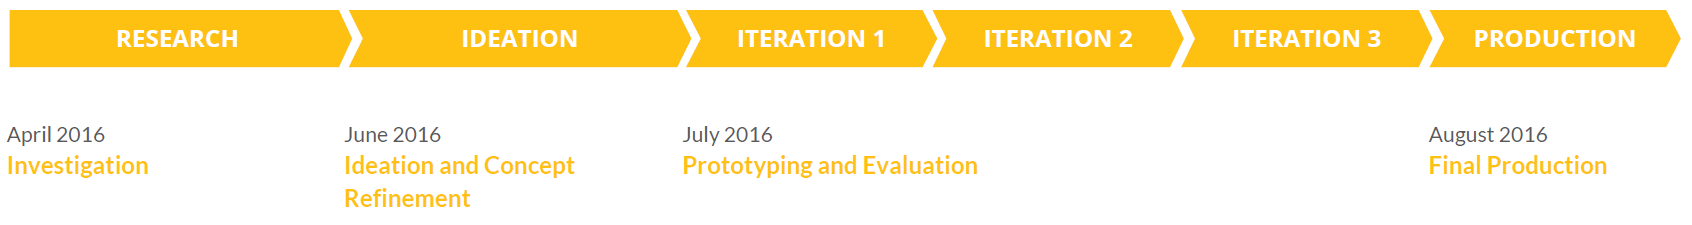
Our process for this journey is rooted in the principles of human-centered design, beginning with deep exploration and research, to dreaming and ideating rich new concepts, through to actually building and testing working prototypes with riders.
We began our project with a focus on answering the following three research questions in order to gain a deep understanding into our problem space.
1. What types of situations or environments would a rider need an increase in situational awareness?
2. What situations and environments are perceived as dangerous by the rider?
3. When are riders cognitively taxed?
We answered these questions using the following methods:
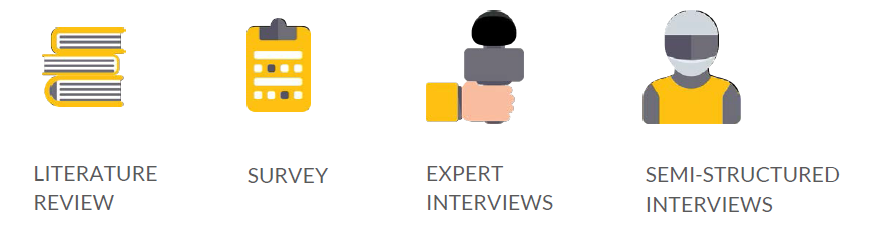
Through our literature review, we found that motorcycling requires a high level of situational awareness. While on the bike, the rider is constantly perceiving information about their environment, processing that information, and then making a decision on how to react while managing their own mental and physical workload (Bellet & Banet, 2012).
The necessity to maintain a high level of situational awareness is further magnified by the lack of protection that a motorcycle provides vs a car due to the lack of a protective barrier between the rider and their environment. A list of common hazards for riders was identified based on a report of recent trends in motorcycle crashes published by the NHTSA.
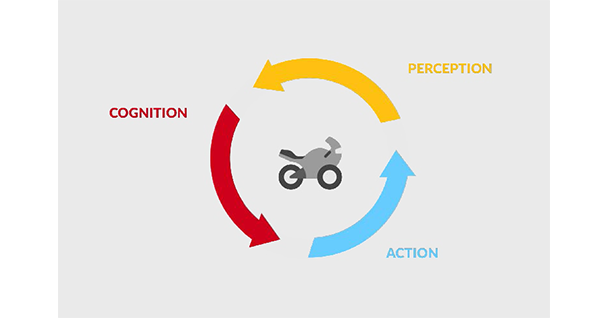
Motorcycle perception-cognition-action mental model
In order to increase our sample size of participants, we created a survey using Qualtrics. The questions were based off information found from our literature review. We ended up receiving feedback from over 240 riders, with participants skewing on the younger side.
We focused on identifying the most dangerous situations riders encountered, as well as what technological solutions they wished for the most. We also asked for basic demographic information such as age, experience level, gear used, willingness to adopt new technology, and riding environment (city vs rural)
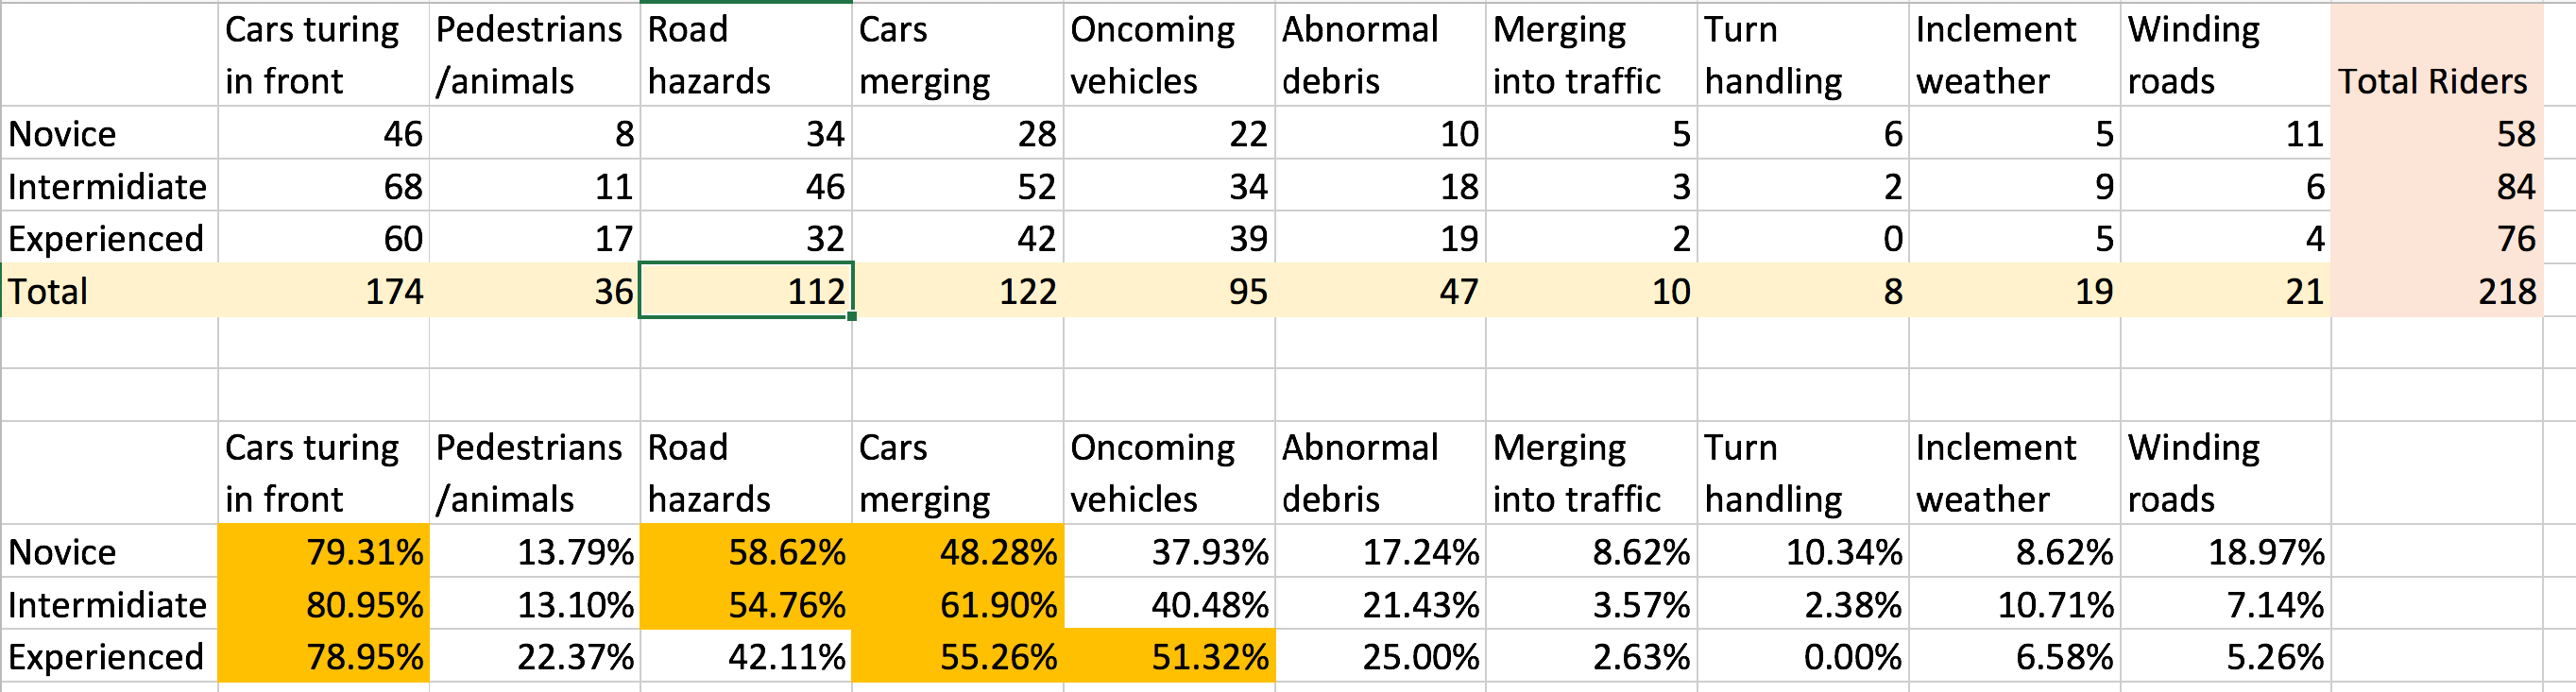
Most dangerous situations on the road by experience level
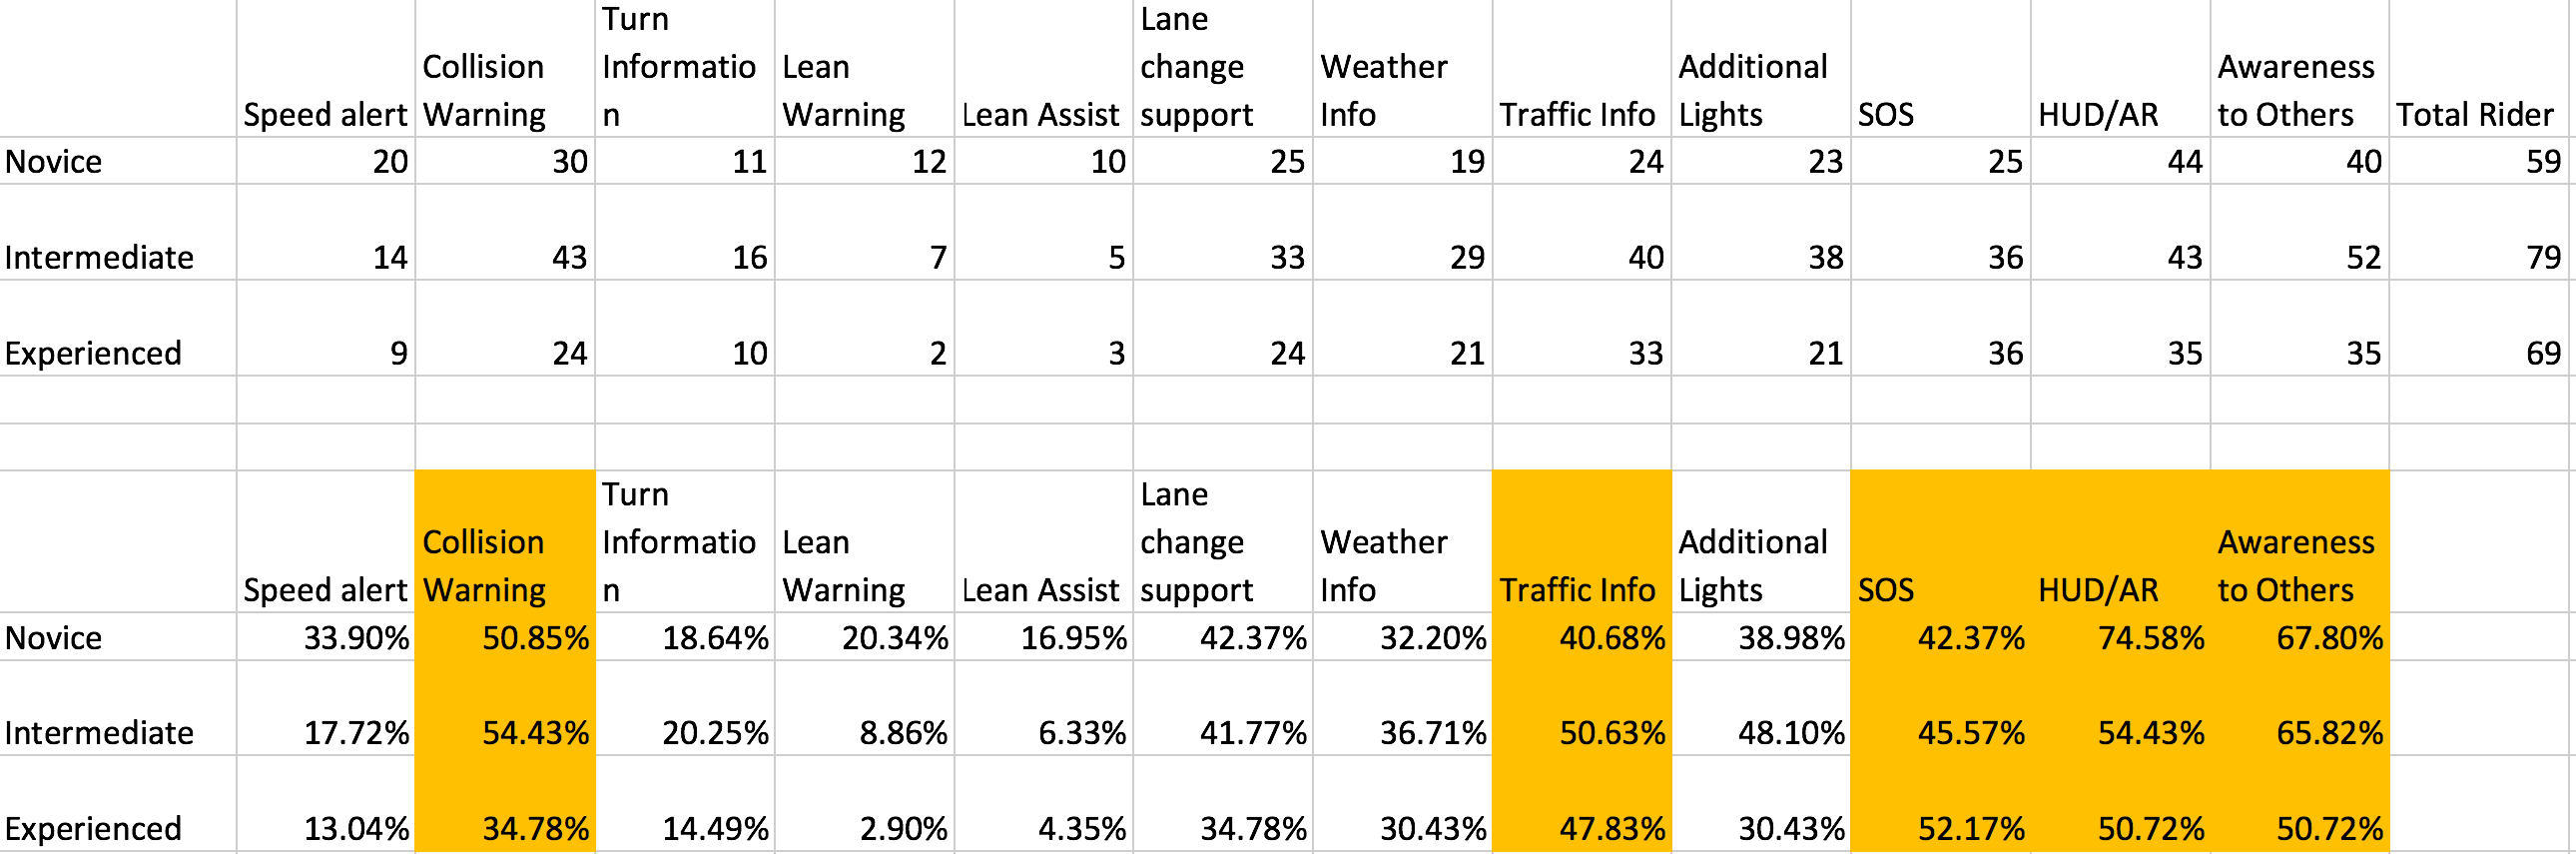
Most desired technological solutions by experience level
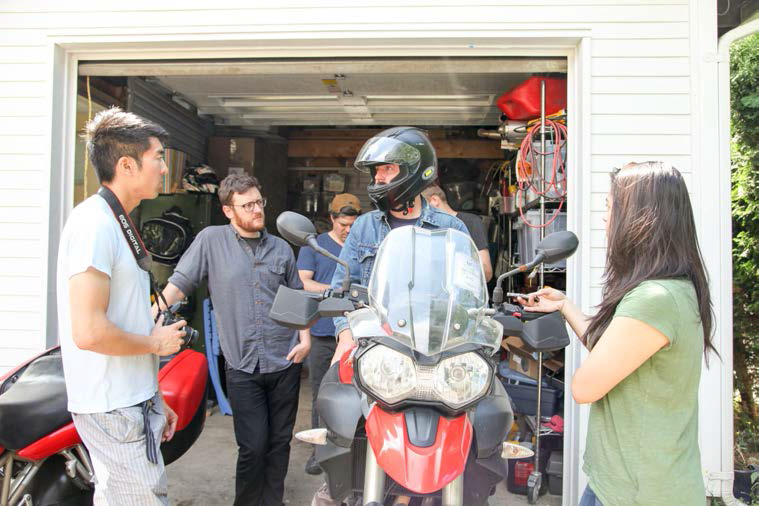
We interviewed 5 subject matter experts from UW, Harley Davidson, Garmin, and BMW and learned that the design of a system to support the rider should make them smarter on the road. Specificallly it should shorten the time between intent and action, and anticipate the needs of the rider to help them make quick and accurate decisions through meaningful and relevant information. One example demoed to us was the BMW Navigator V used for navigation.
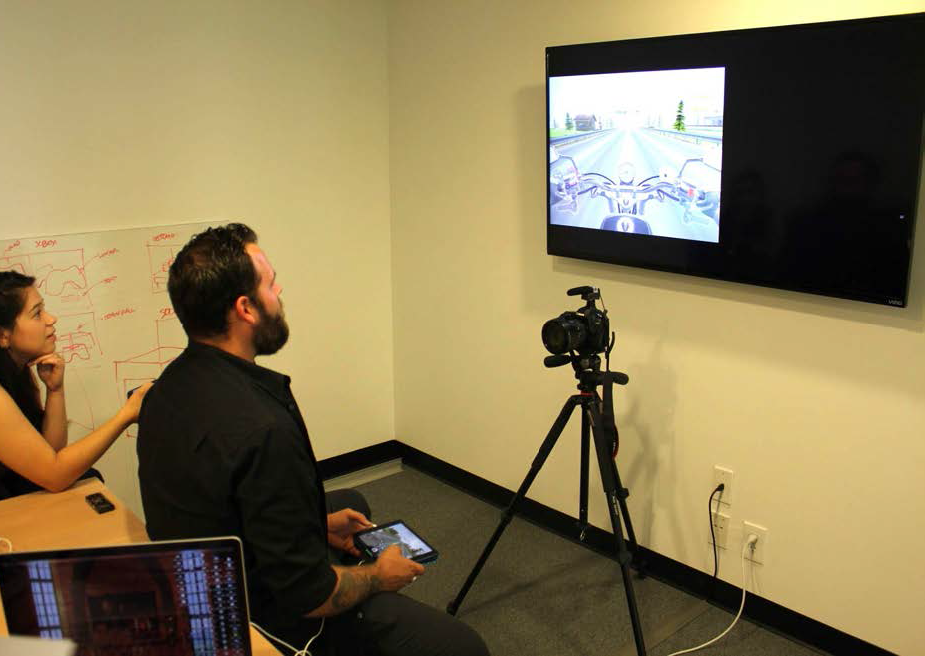
We also learned that over reliance on a system could lead to degradation in riding skills. An example was blind spot indicators in cars, which could lead to riders becoming less aware of what's coming up behind them. We observed this in action by shadowing a user study by Dr. Linda Boyle, who is a transportation expert in automotive safety at UW. She runs a car simulator on campus which is used to test for cognitive overload/reaction time for automotive UI design.
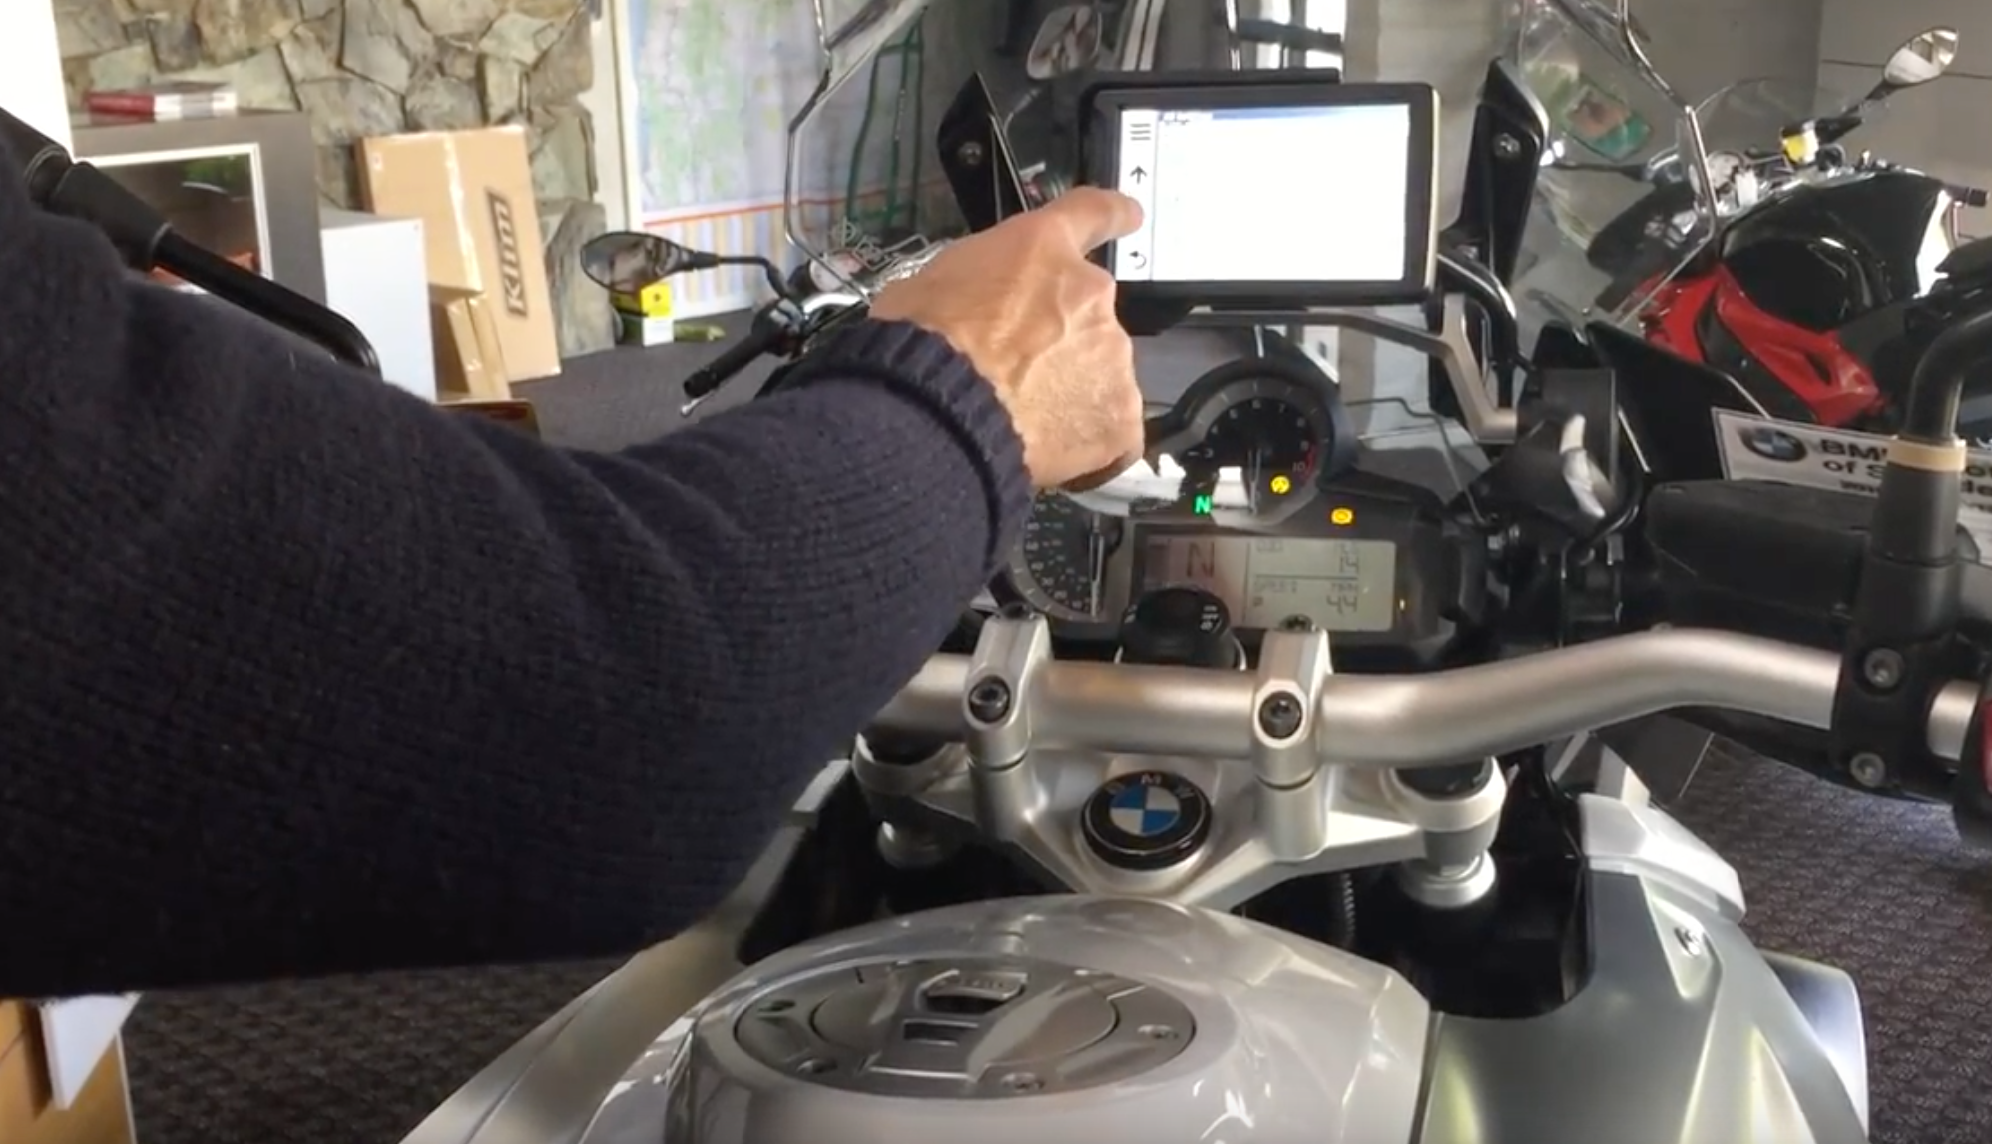
Demo of BWM Navigator V
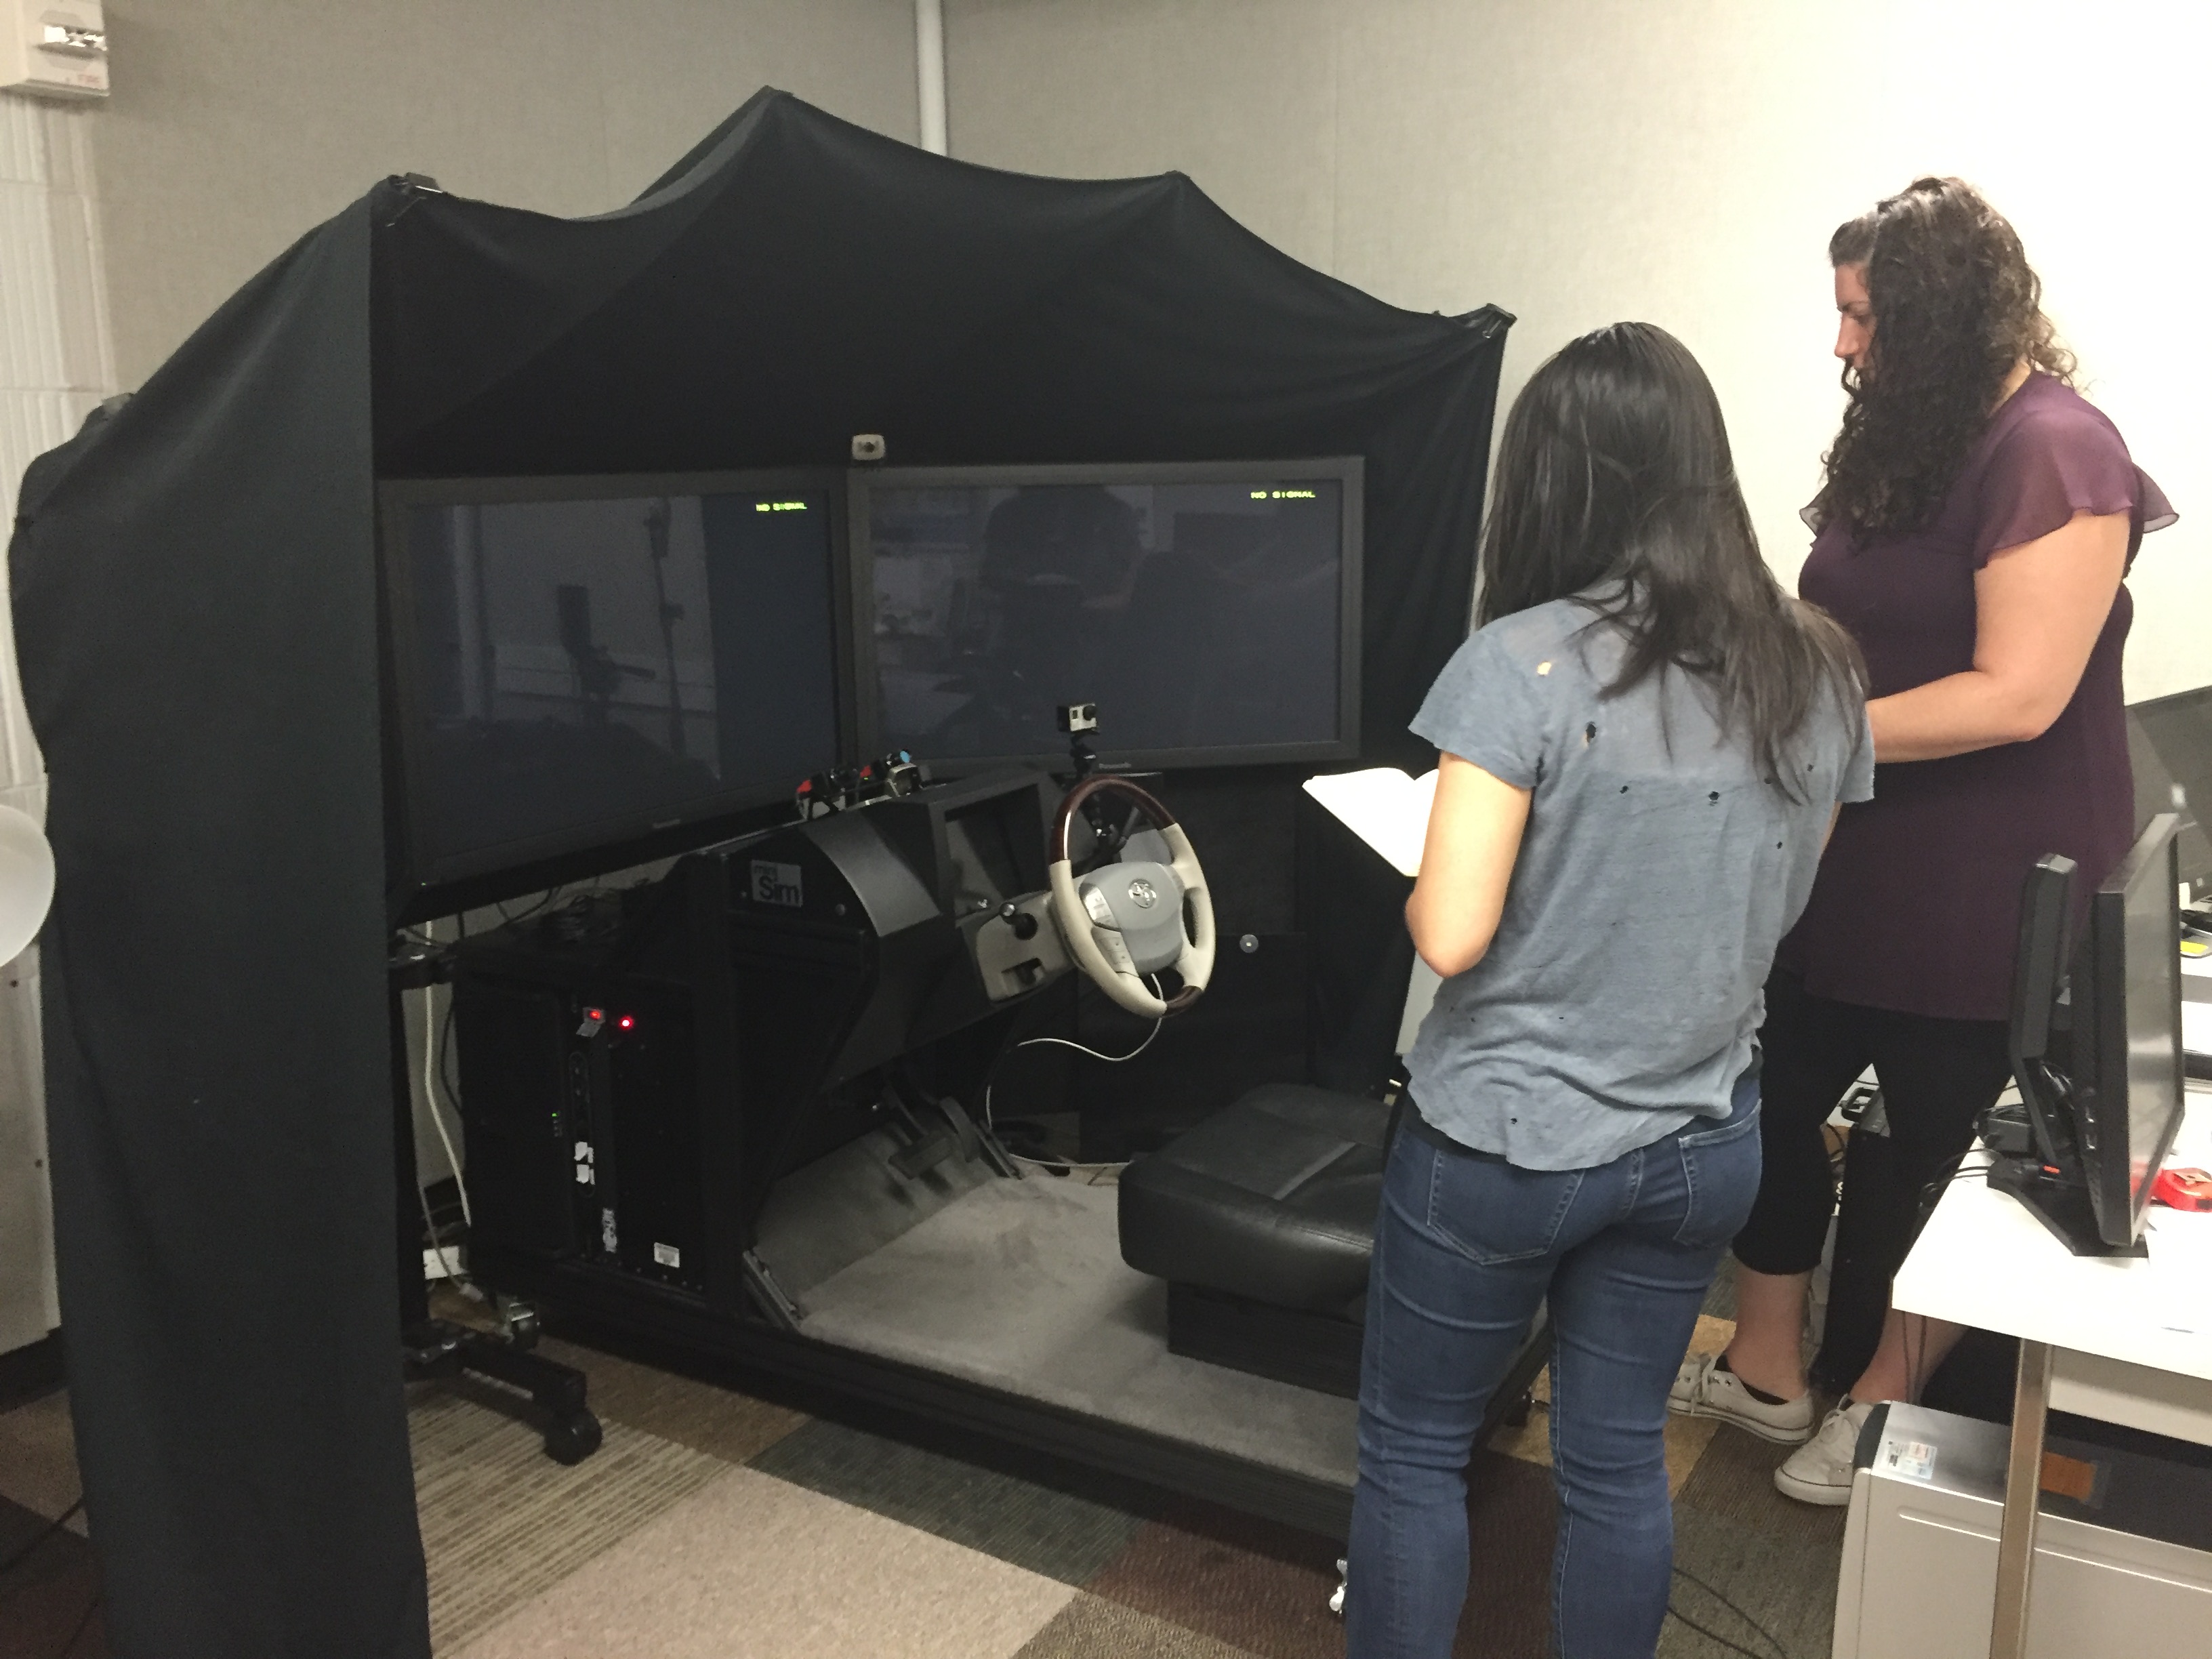
Car simulator run by Dr. Linda Boyle
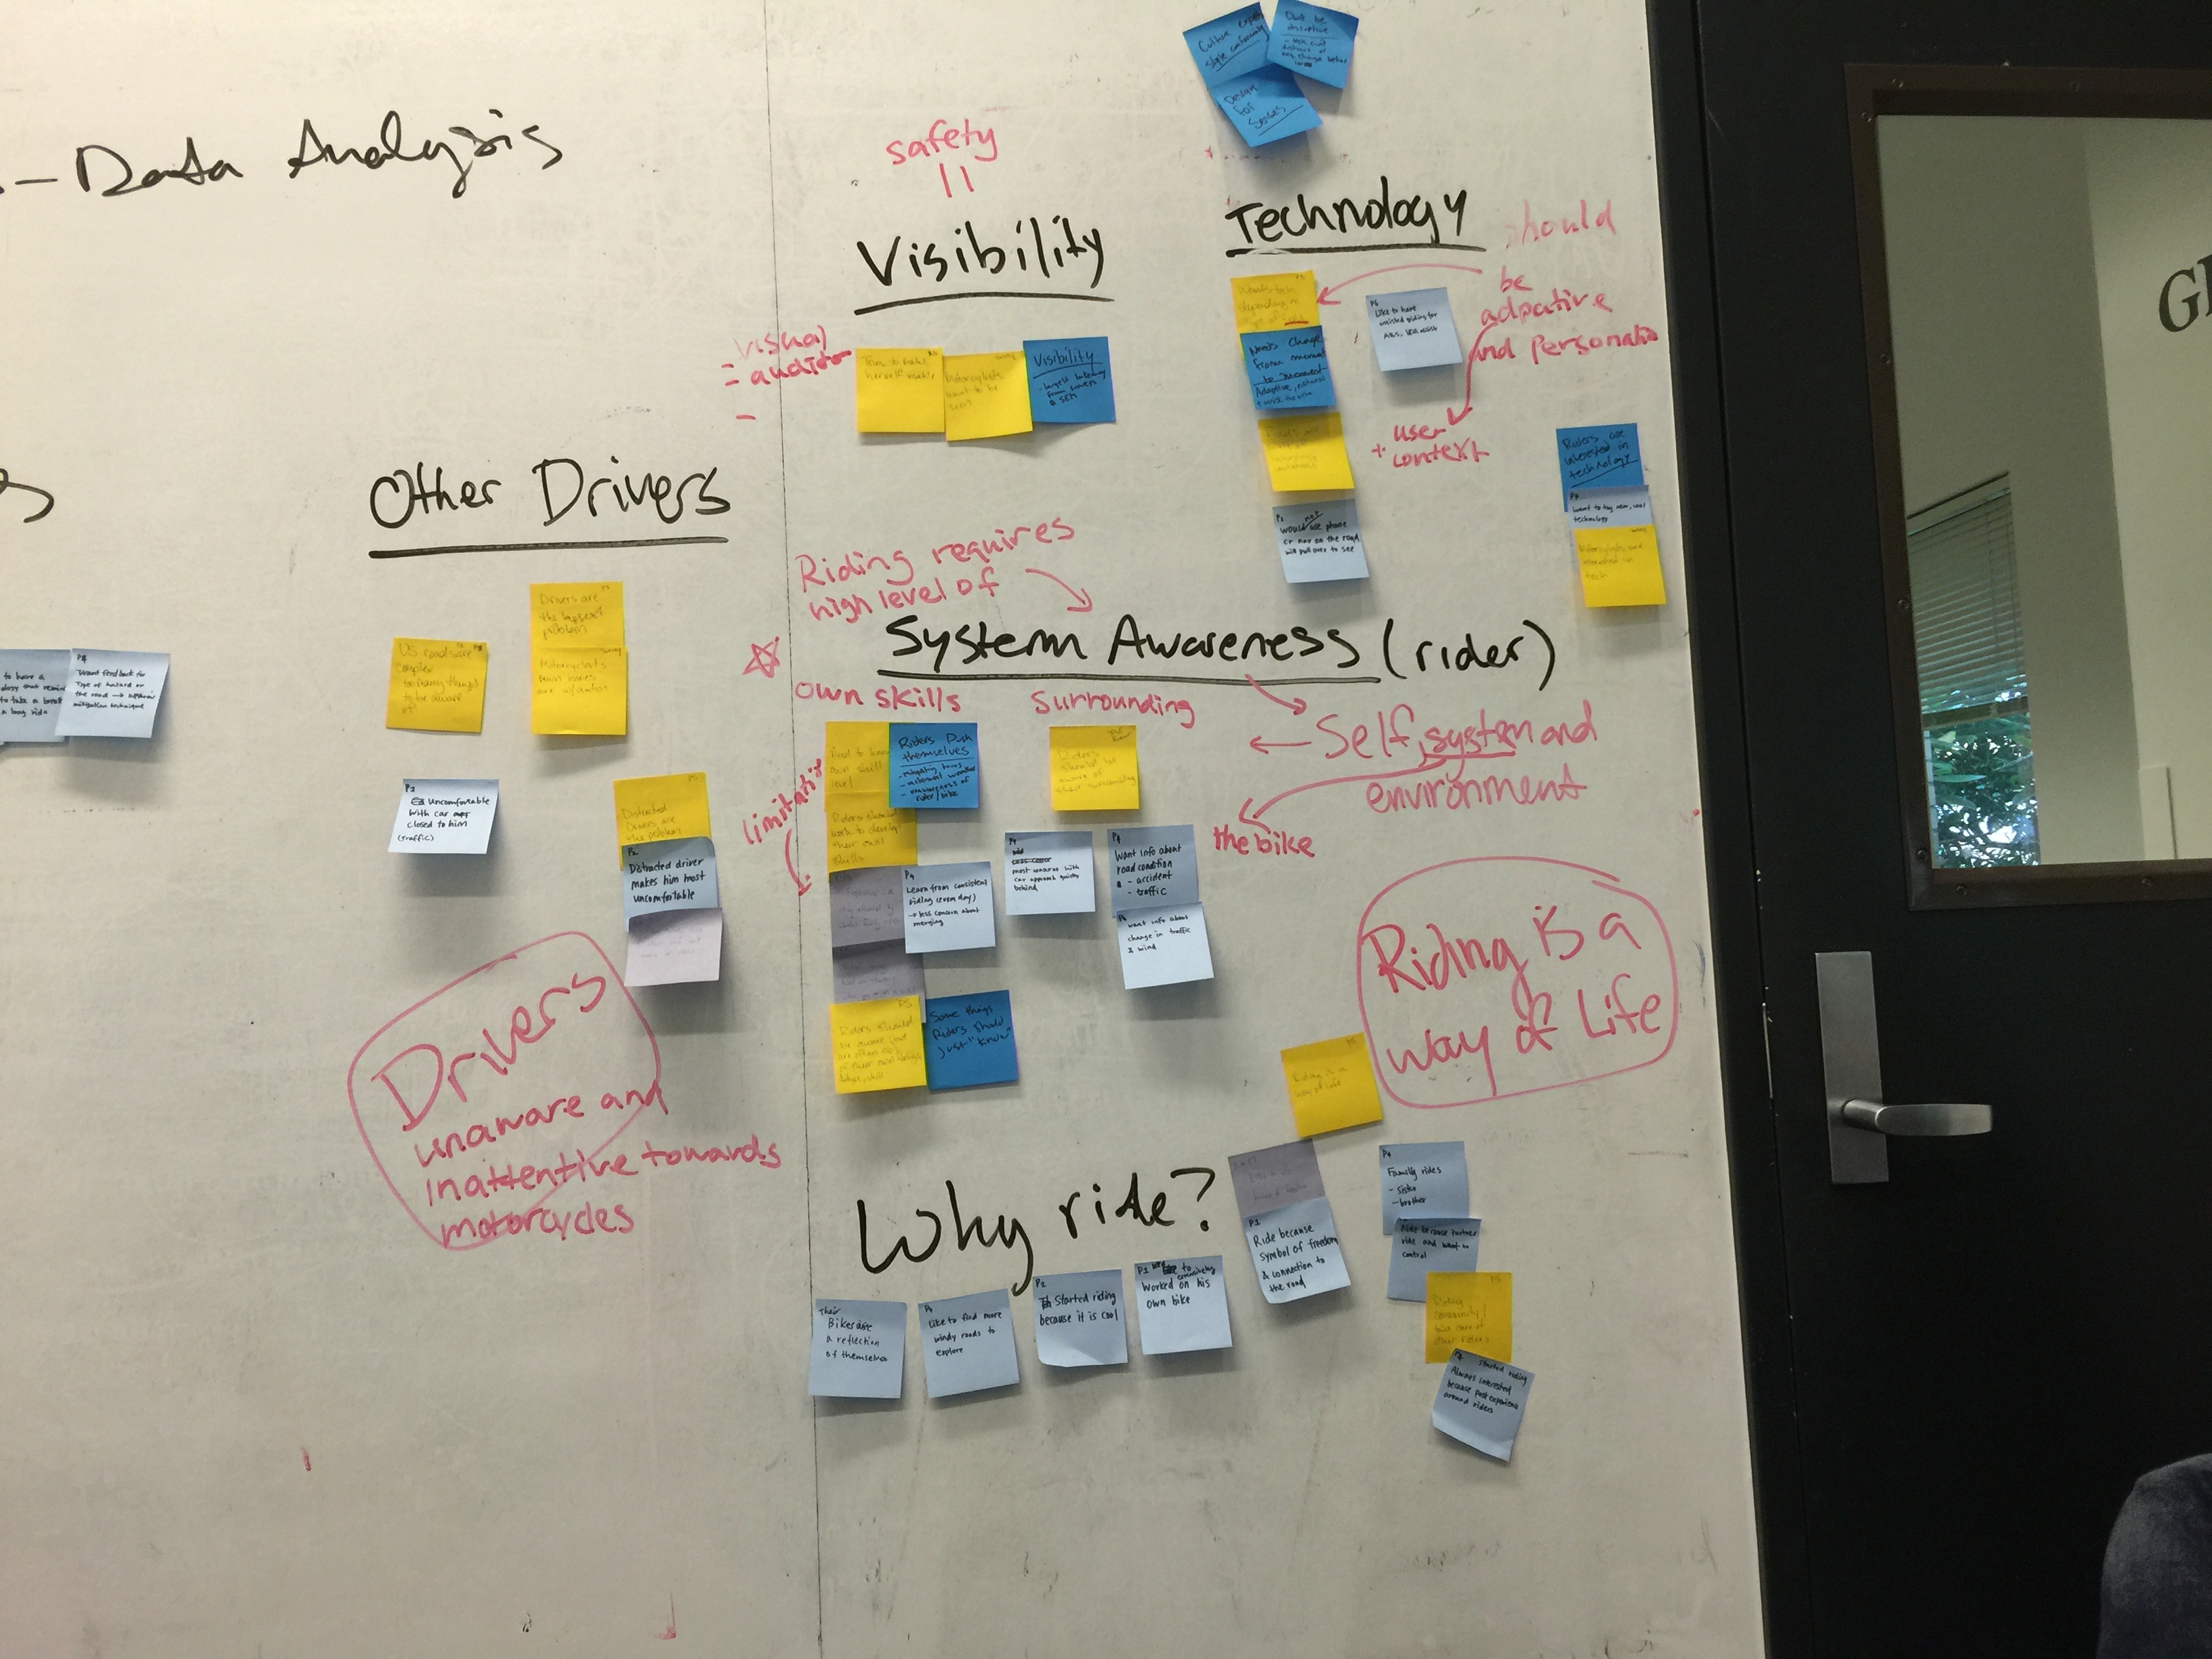
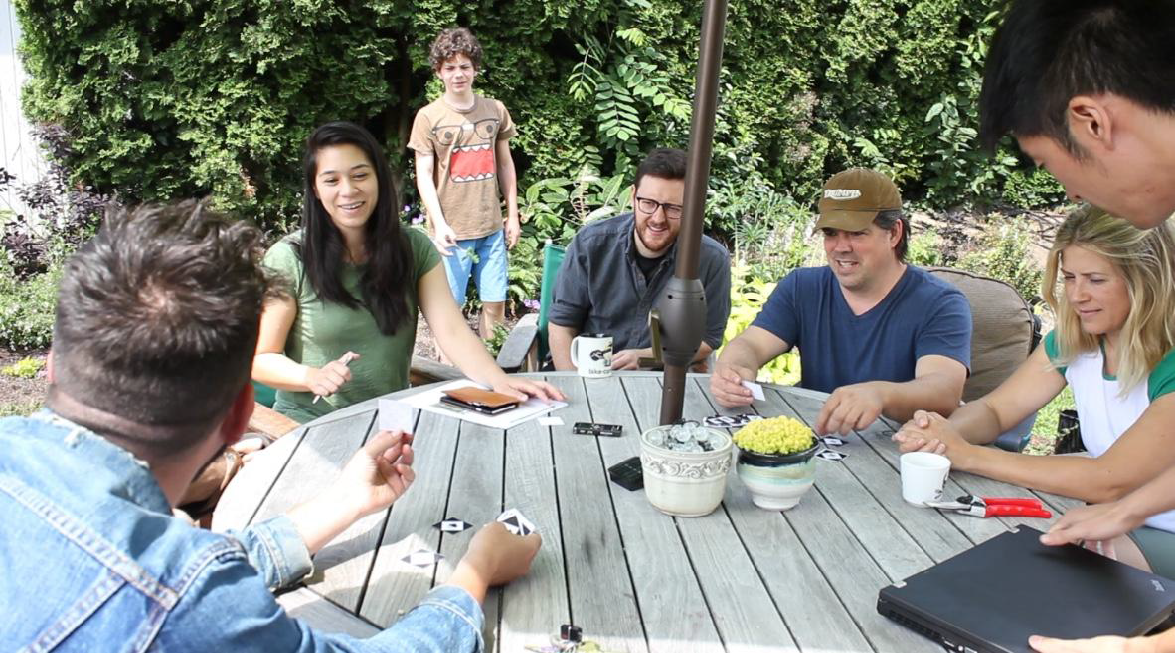
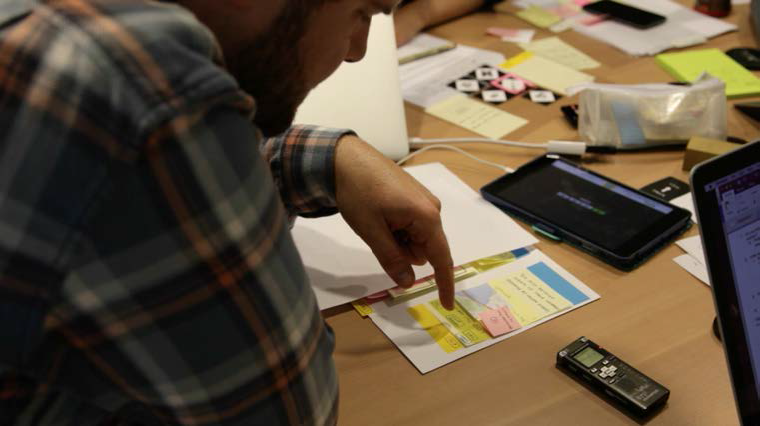
After that, we conducted interviews with 7 riders from varying levels of riding experience. The interviews were recorded and later transcribed for key quotes which were placed on post it notes. Then we created an affinity diagram using the post it notes to identify common themes from our participants which were:
1. Visibility is key to safety
2. Drivers are inattentive & unaware of motorcycles
3. Riding requires a high level of awareness of self, system, and the environment
4. Technology should be adaptive and can't overload the rider
5. Riding is a way of life, so technology should not detract from the experience
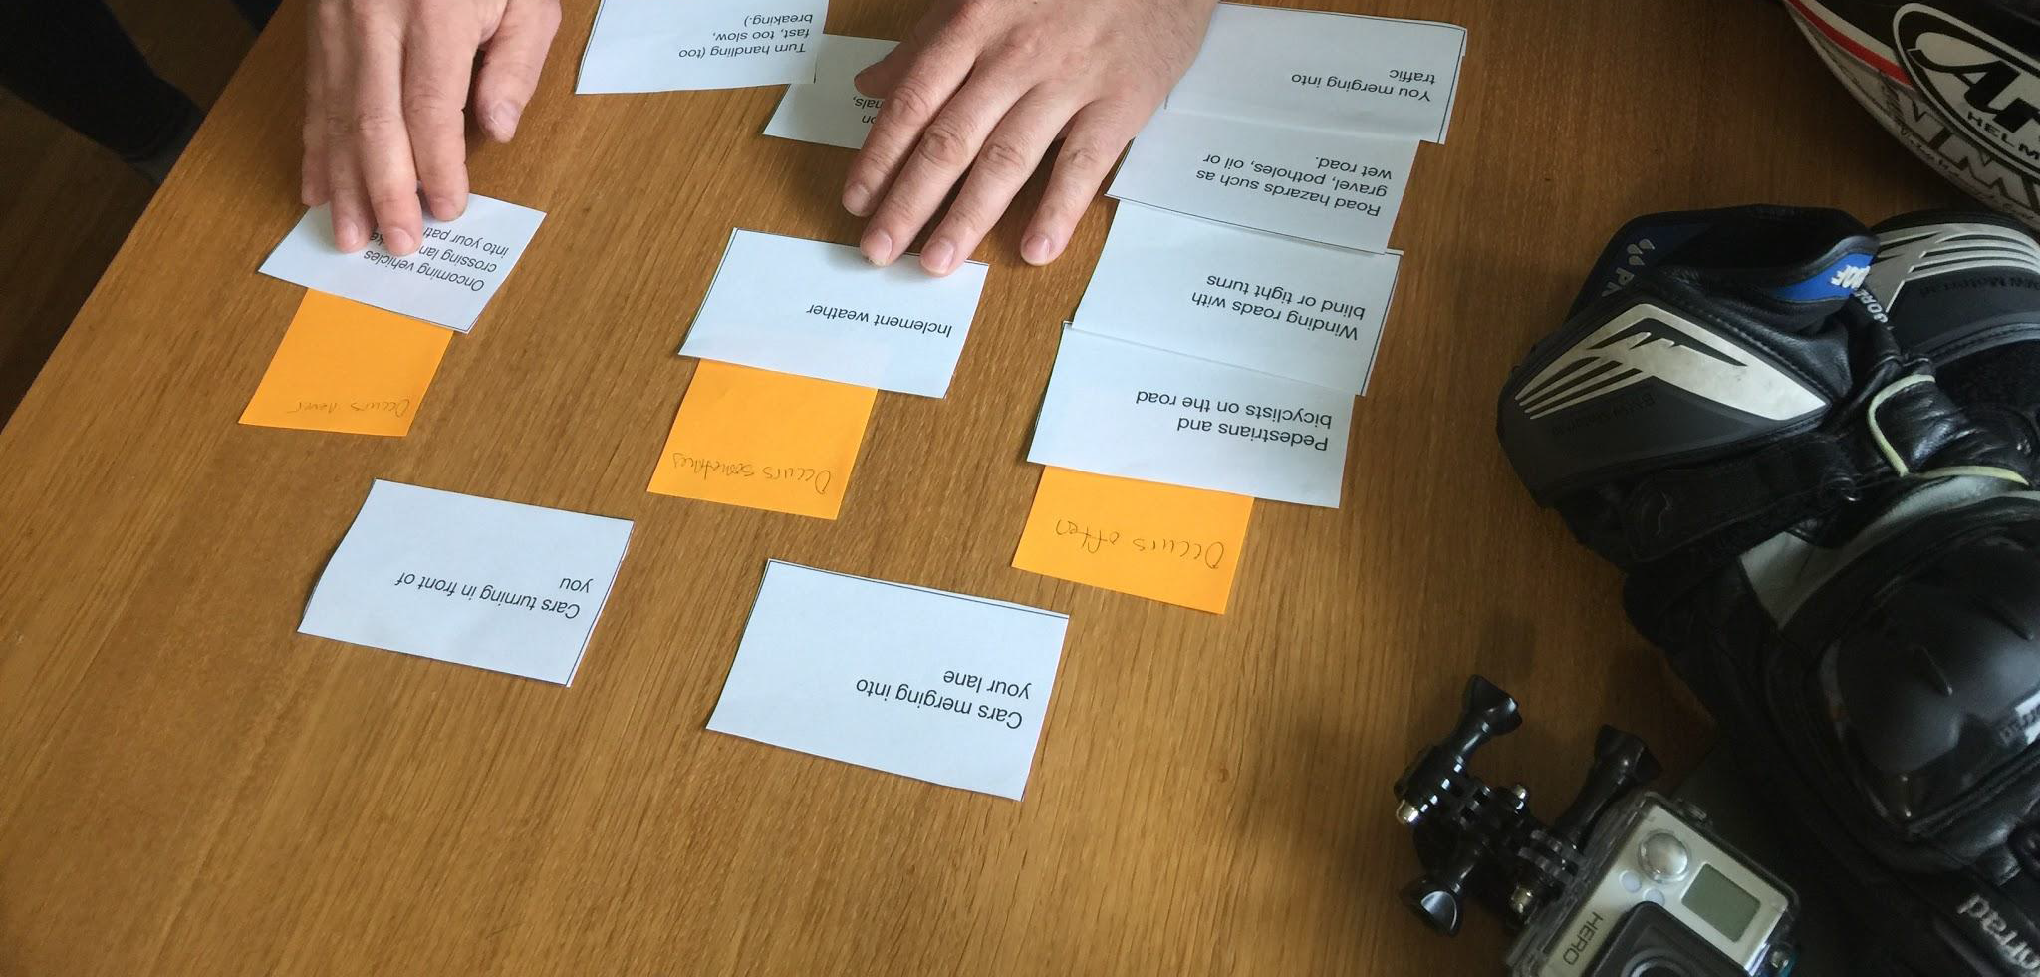
We also conducted a card-sorting task to rank how frequently riders encounter certain hazards and which ones they perceive to be the most dangerous. Situations involving cars were ranked as the most dangerous. However all riders spoke of mitigation strategies to deal with this such as making sure the driver looks them in the eye before turning or revving their engine to make others aware of them.
Unexpected hazards like gravel, oil, bad weather, etc were regularly encountered by 6 out of the 7 riders interviewed. Although they weren't ranked as dangerous as other drivers, there were no mitigation strategies available due to the lack of time to respond. Many of them also stated that they had dropped their bike due to these unexpected hazards.
Based on our research we came up with 3 key findings:
1. The system should avoid cognitive overload while giving the rider time to plan ahead
2. Other drivers are the biggest danger to riders, and visibility is key to safety
3. A successful system should not interfere with the rider's experience on the road
These were then transformed into design prompts for our ideation phase:
1. How can we reduce the cognitive load of motorcyclists?
2. What information can we provide to others on the road about motorcyclist behavior?
3. What suggestions could be provided to riders based on their ability?
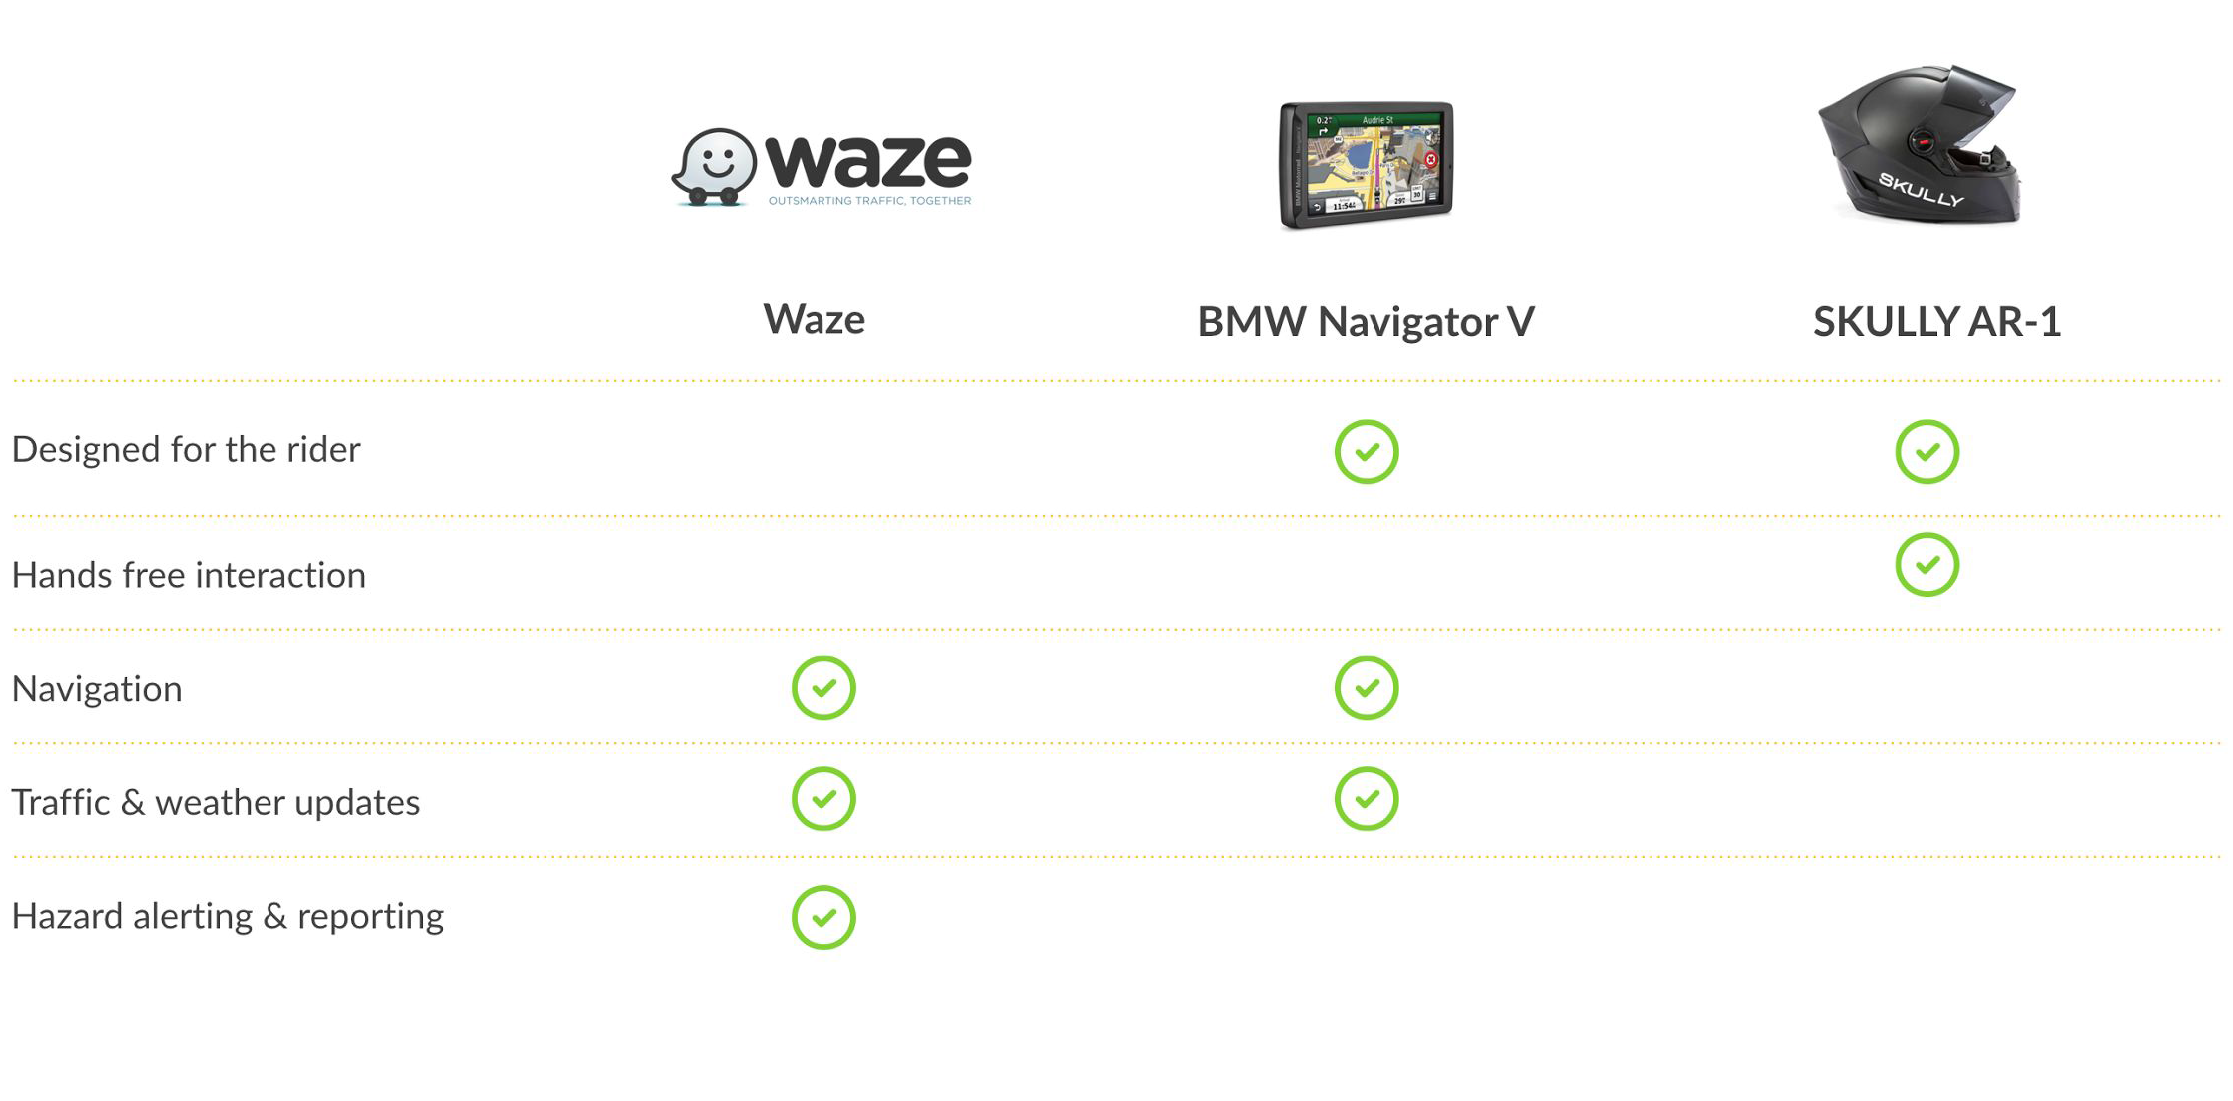
Before moving onto the ideation phase, we also conducted a competitive analysis to make sure an existing system didn't already exist that could satisfy the needs of the rider. It would have to provide situational awareness of what's up ahead and allow the rider to easily and safely interact with the system while on the road.
We identified three current systems available today: Waze, BMW Navigator V, and Skully AR-1. After completing the competitive analysis, we found that although each system had its strengths, there was no one system currently existed to support the rider in all the criteria we had identified from our user research.
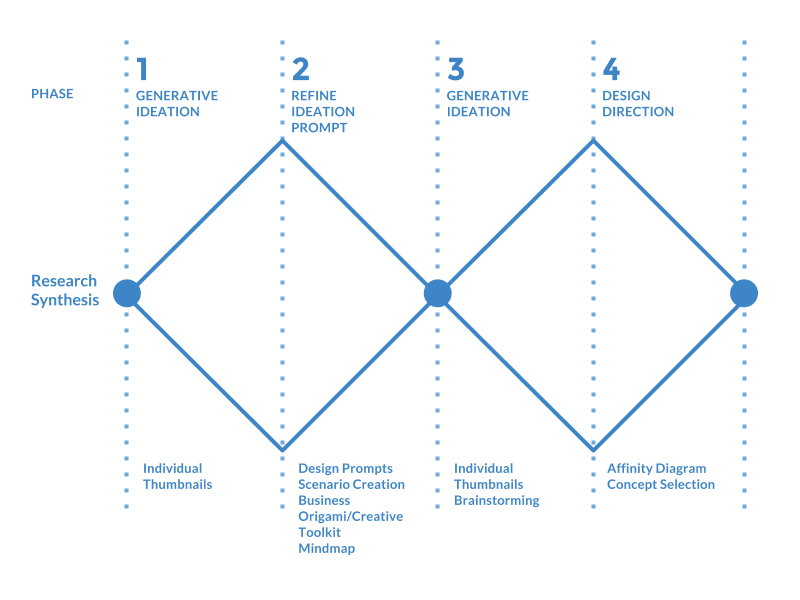
We leveraged both unstructured and structured ideation activities to help generate a broad set of concepts for our design problem. To start, we began diverging from our initial research insights, through generative ideation with thumbnail sketches.
Then we converged and refined our generated ideas through design exercises such as scenario creation business origami toolkits, and mind mapping. Finally, we iterated, going through another round of divergence/convergence, using affinity diagraming to hone in on our design direction.
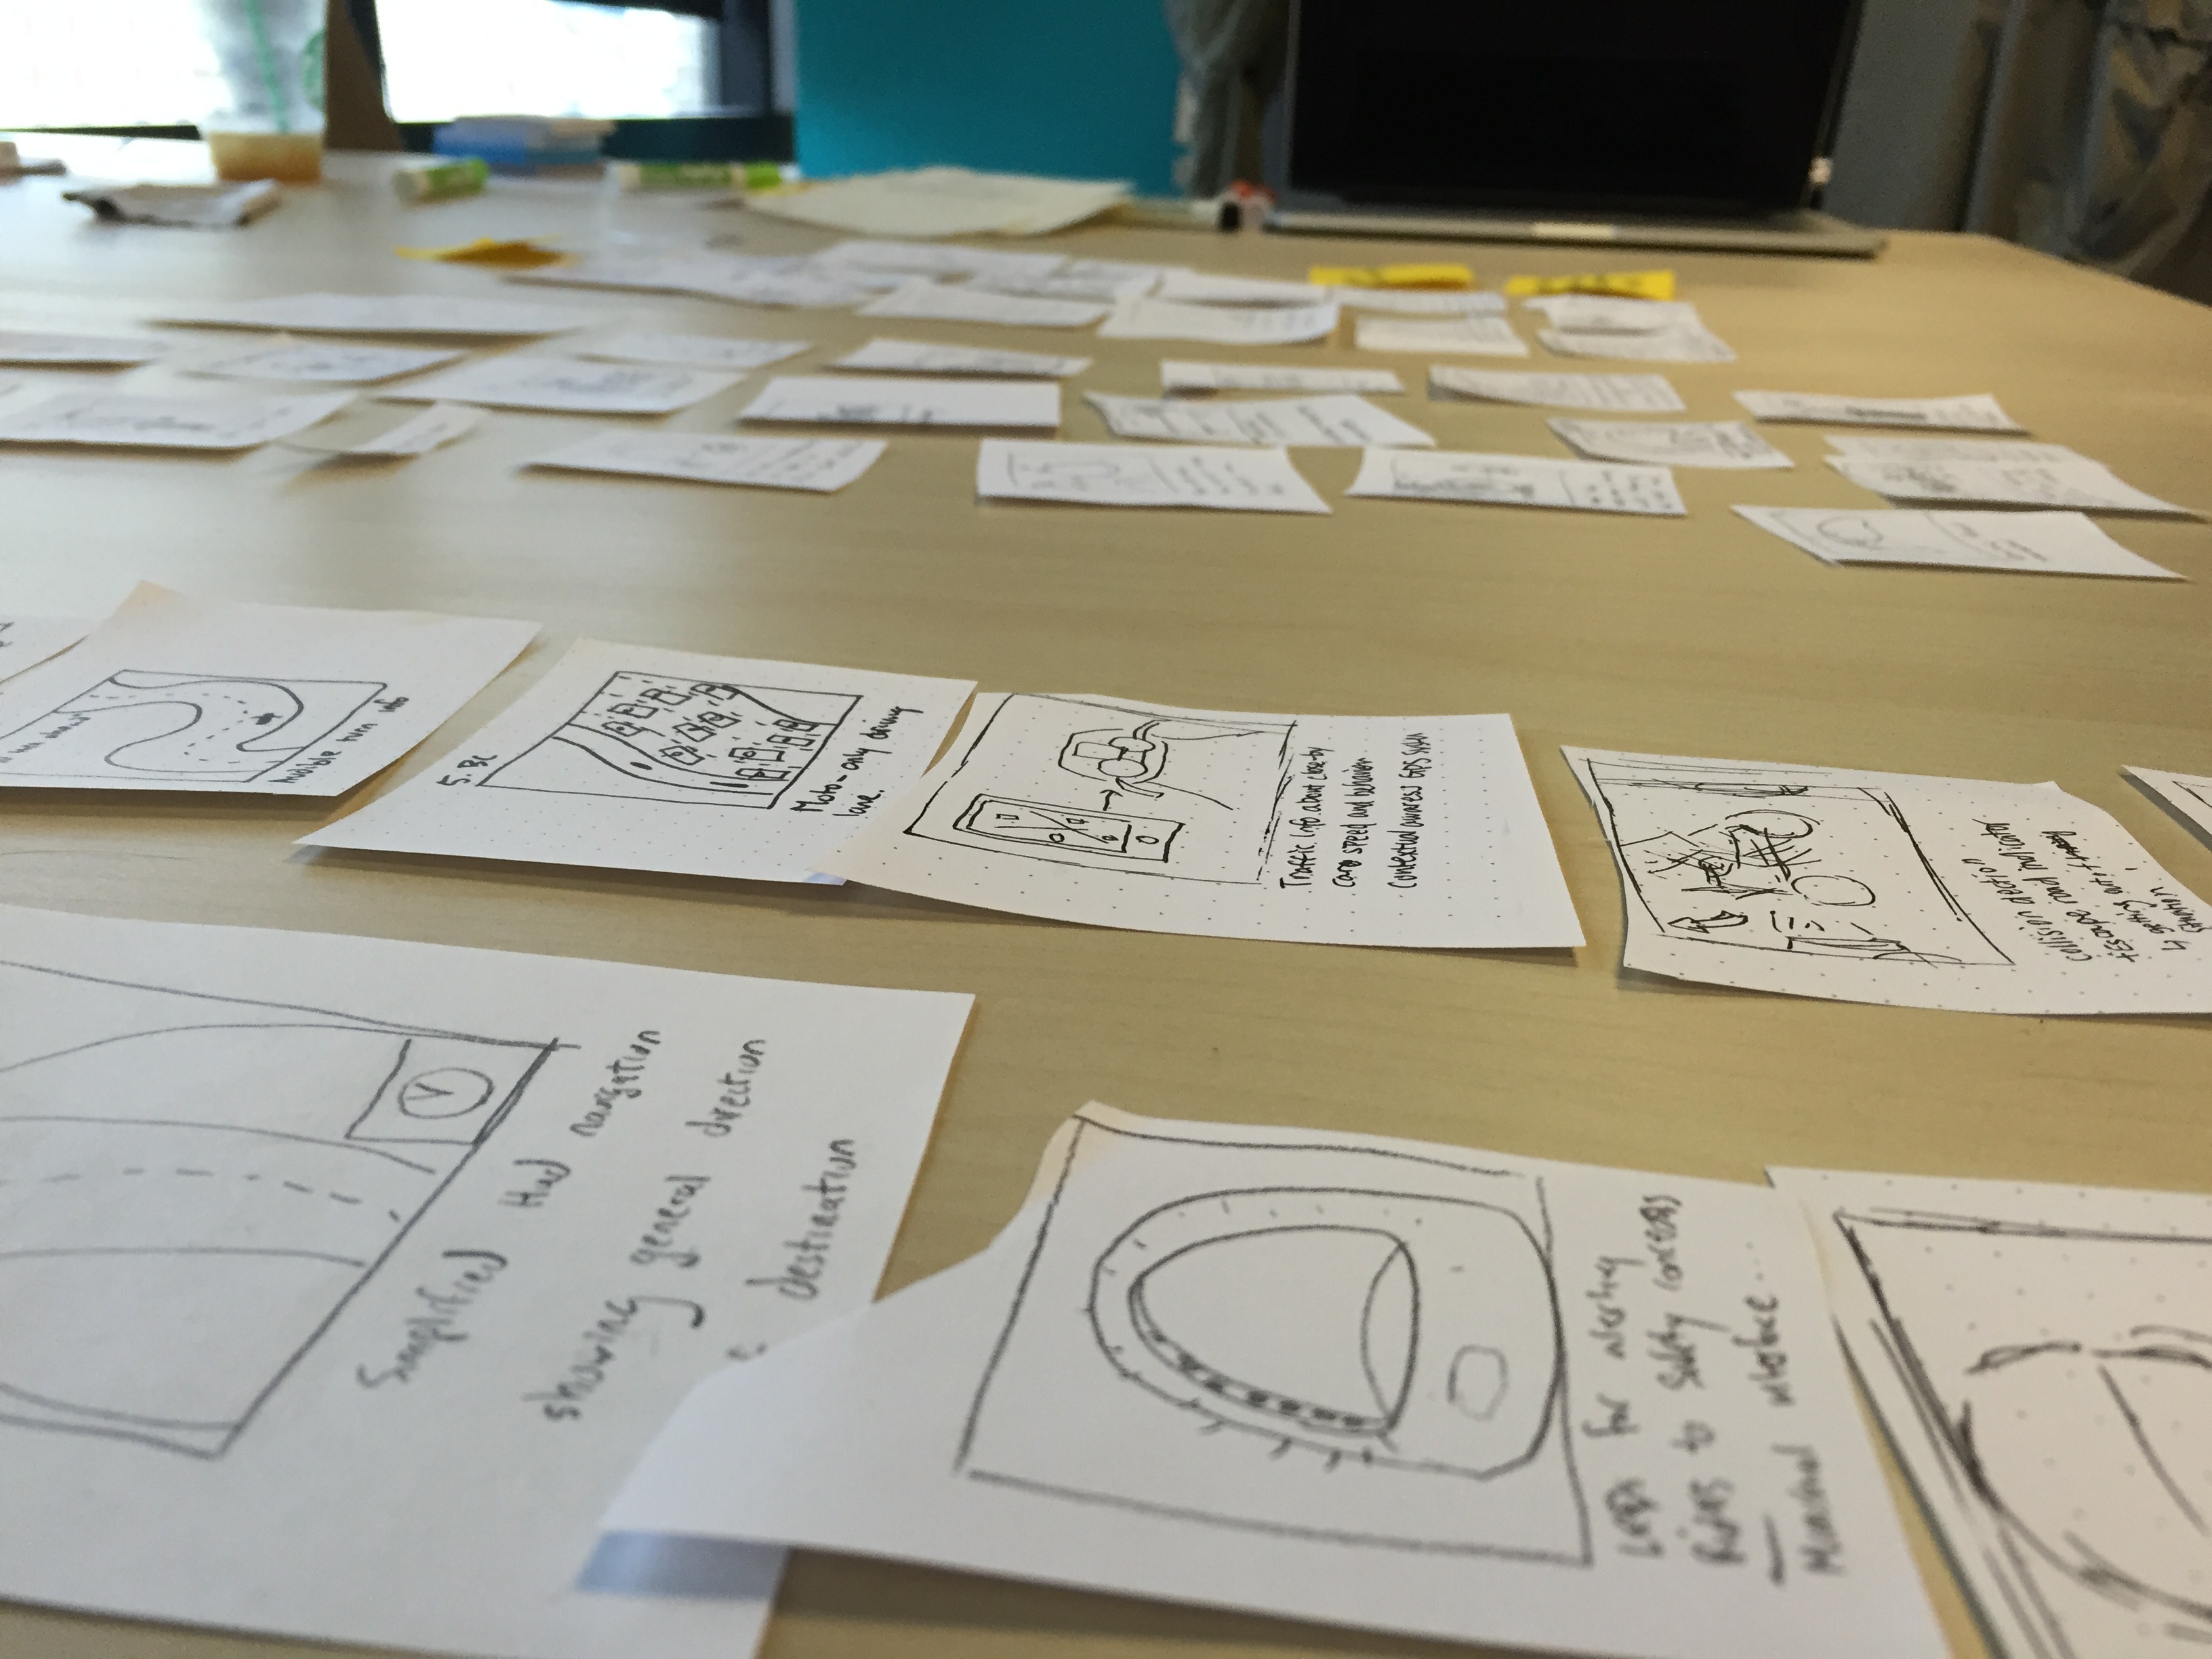
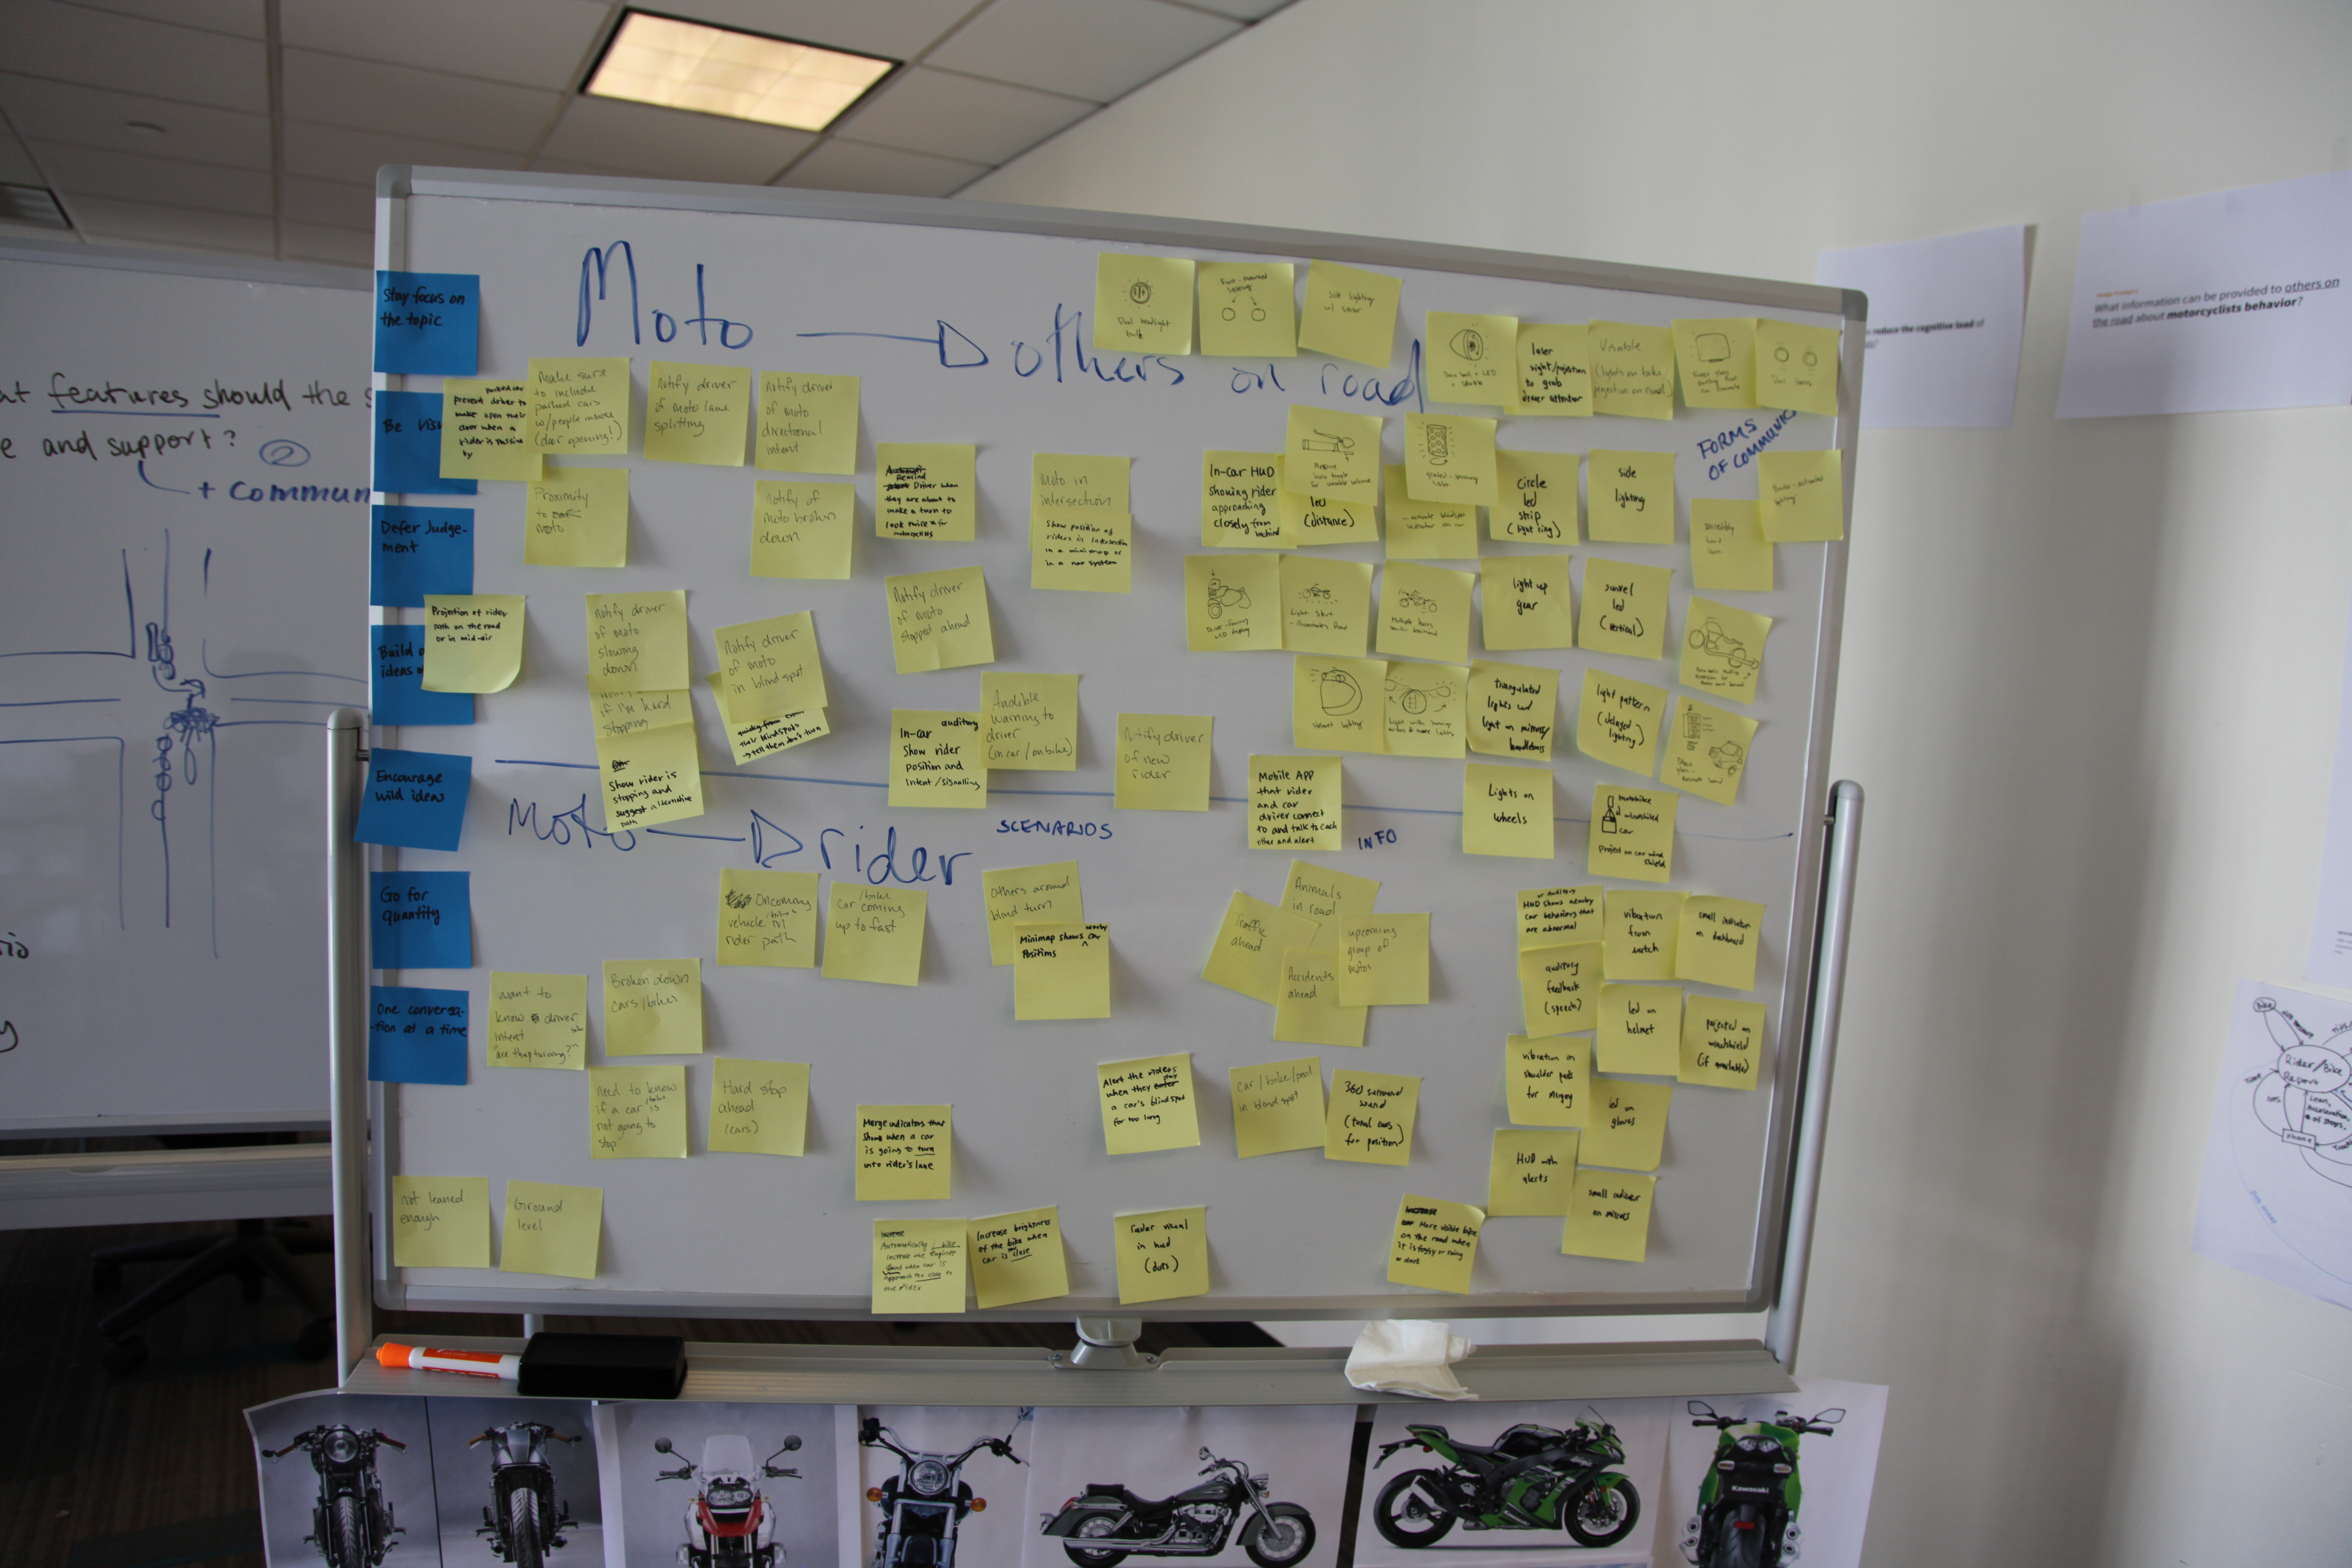
Each team member generated individual thumbnails during a brainstorm session, and then presented their concepts. Duplicate concepts were removed leading to 52 generated concepts in total.
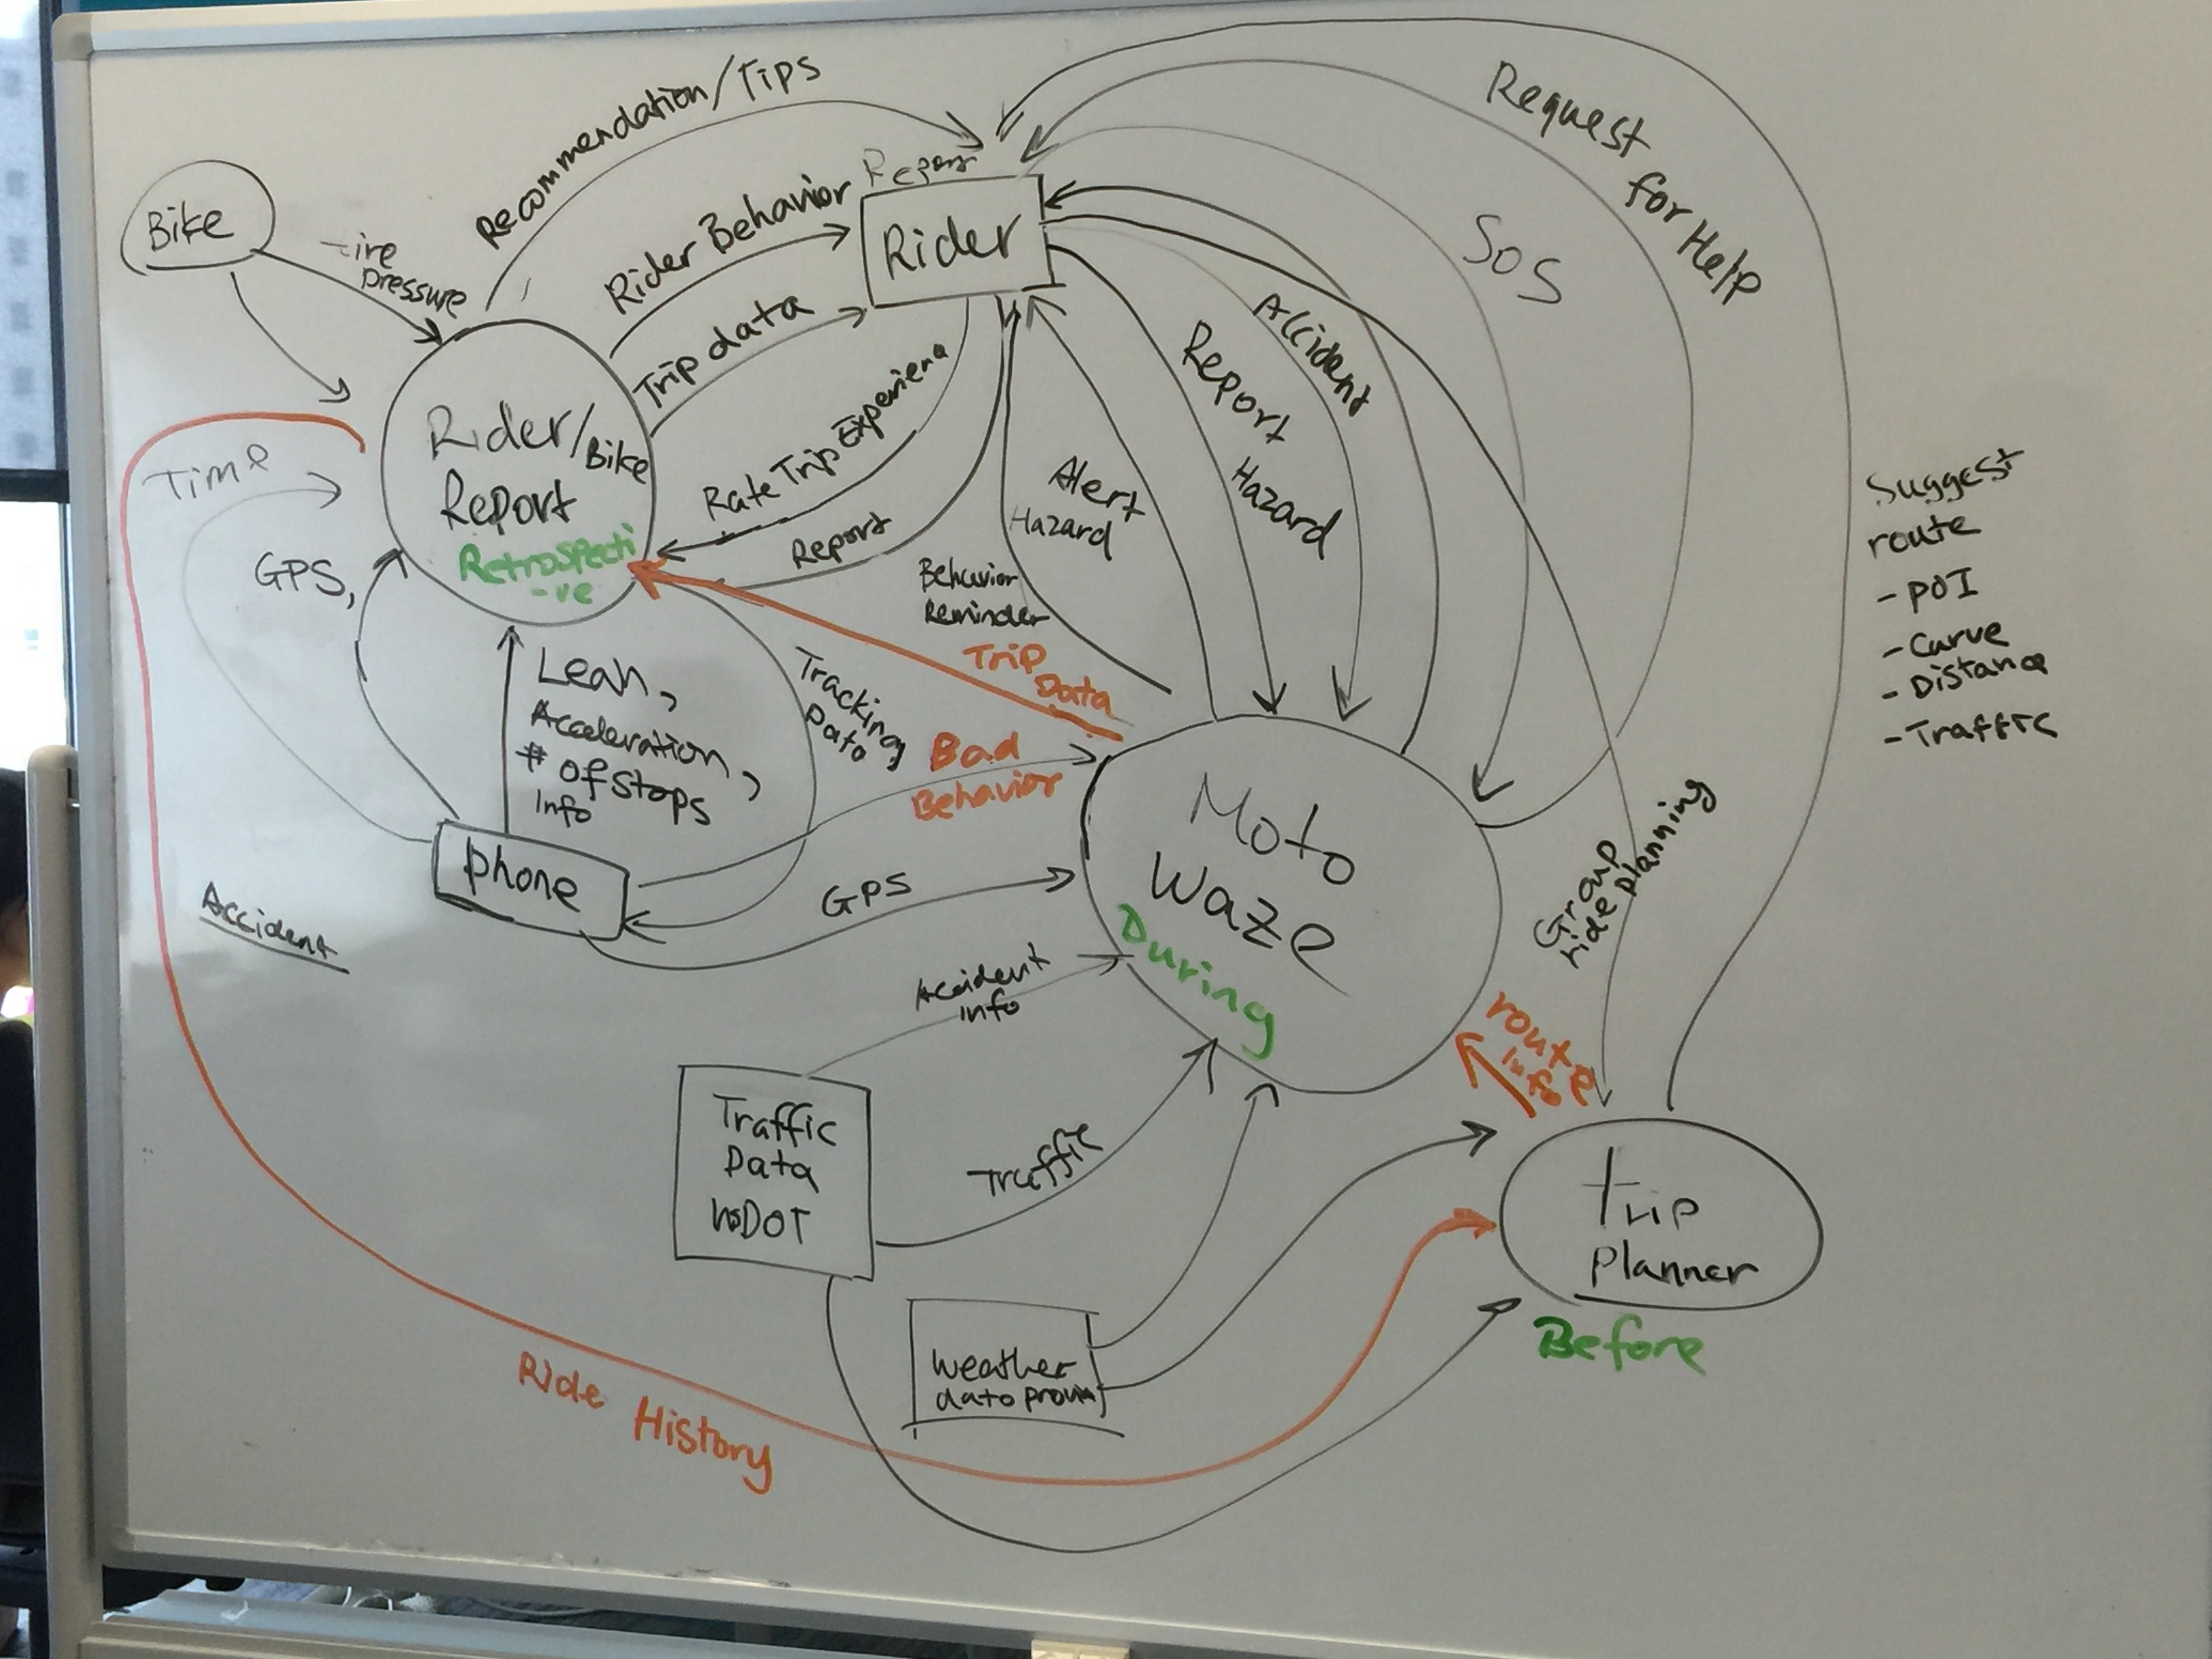
After generating the initial concepts, we grouped them based on how well they mapped to our design prompts from the research phase. We also generated mindmaps to understand the rider's mental model. Finally, we explored how well some of the concepts would function under certain hypothetical scenarios and generated a business origami toolkit to better visualize the scenarios.
Mapping concepts to design prompts
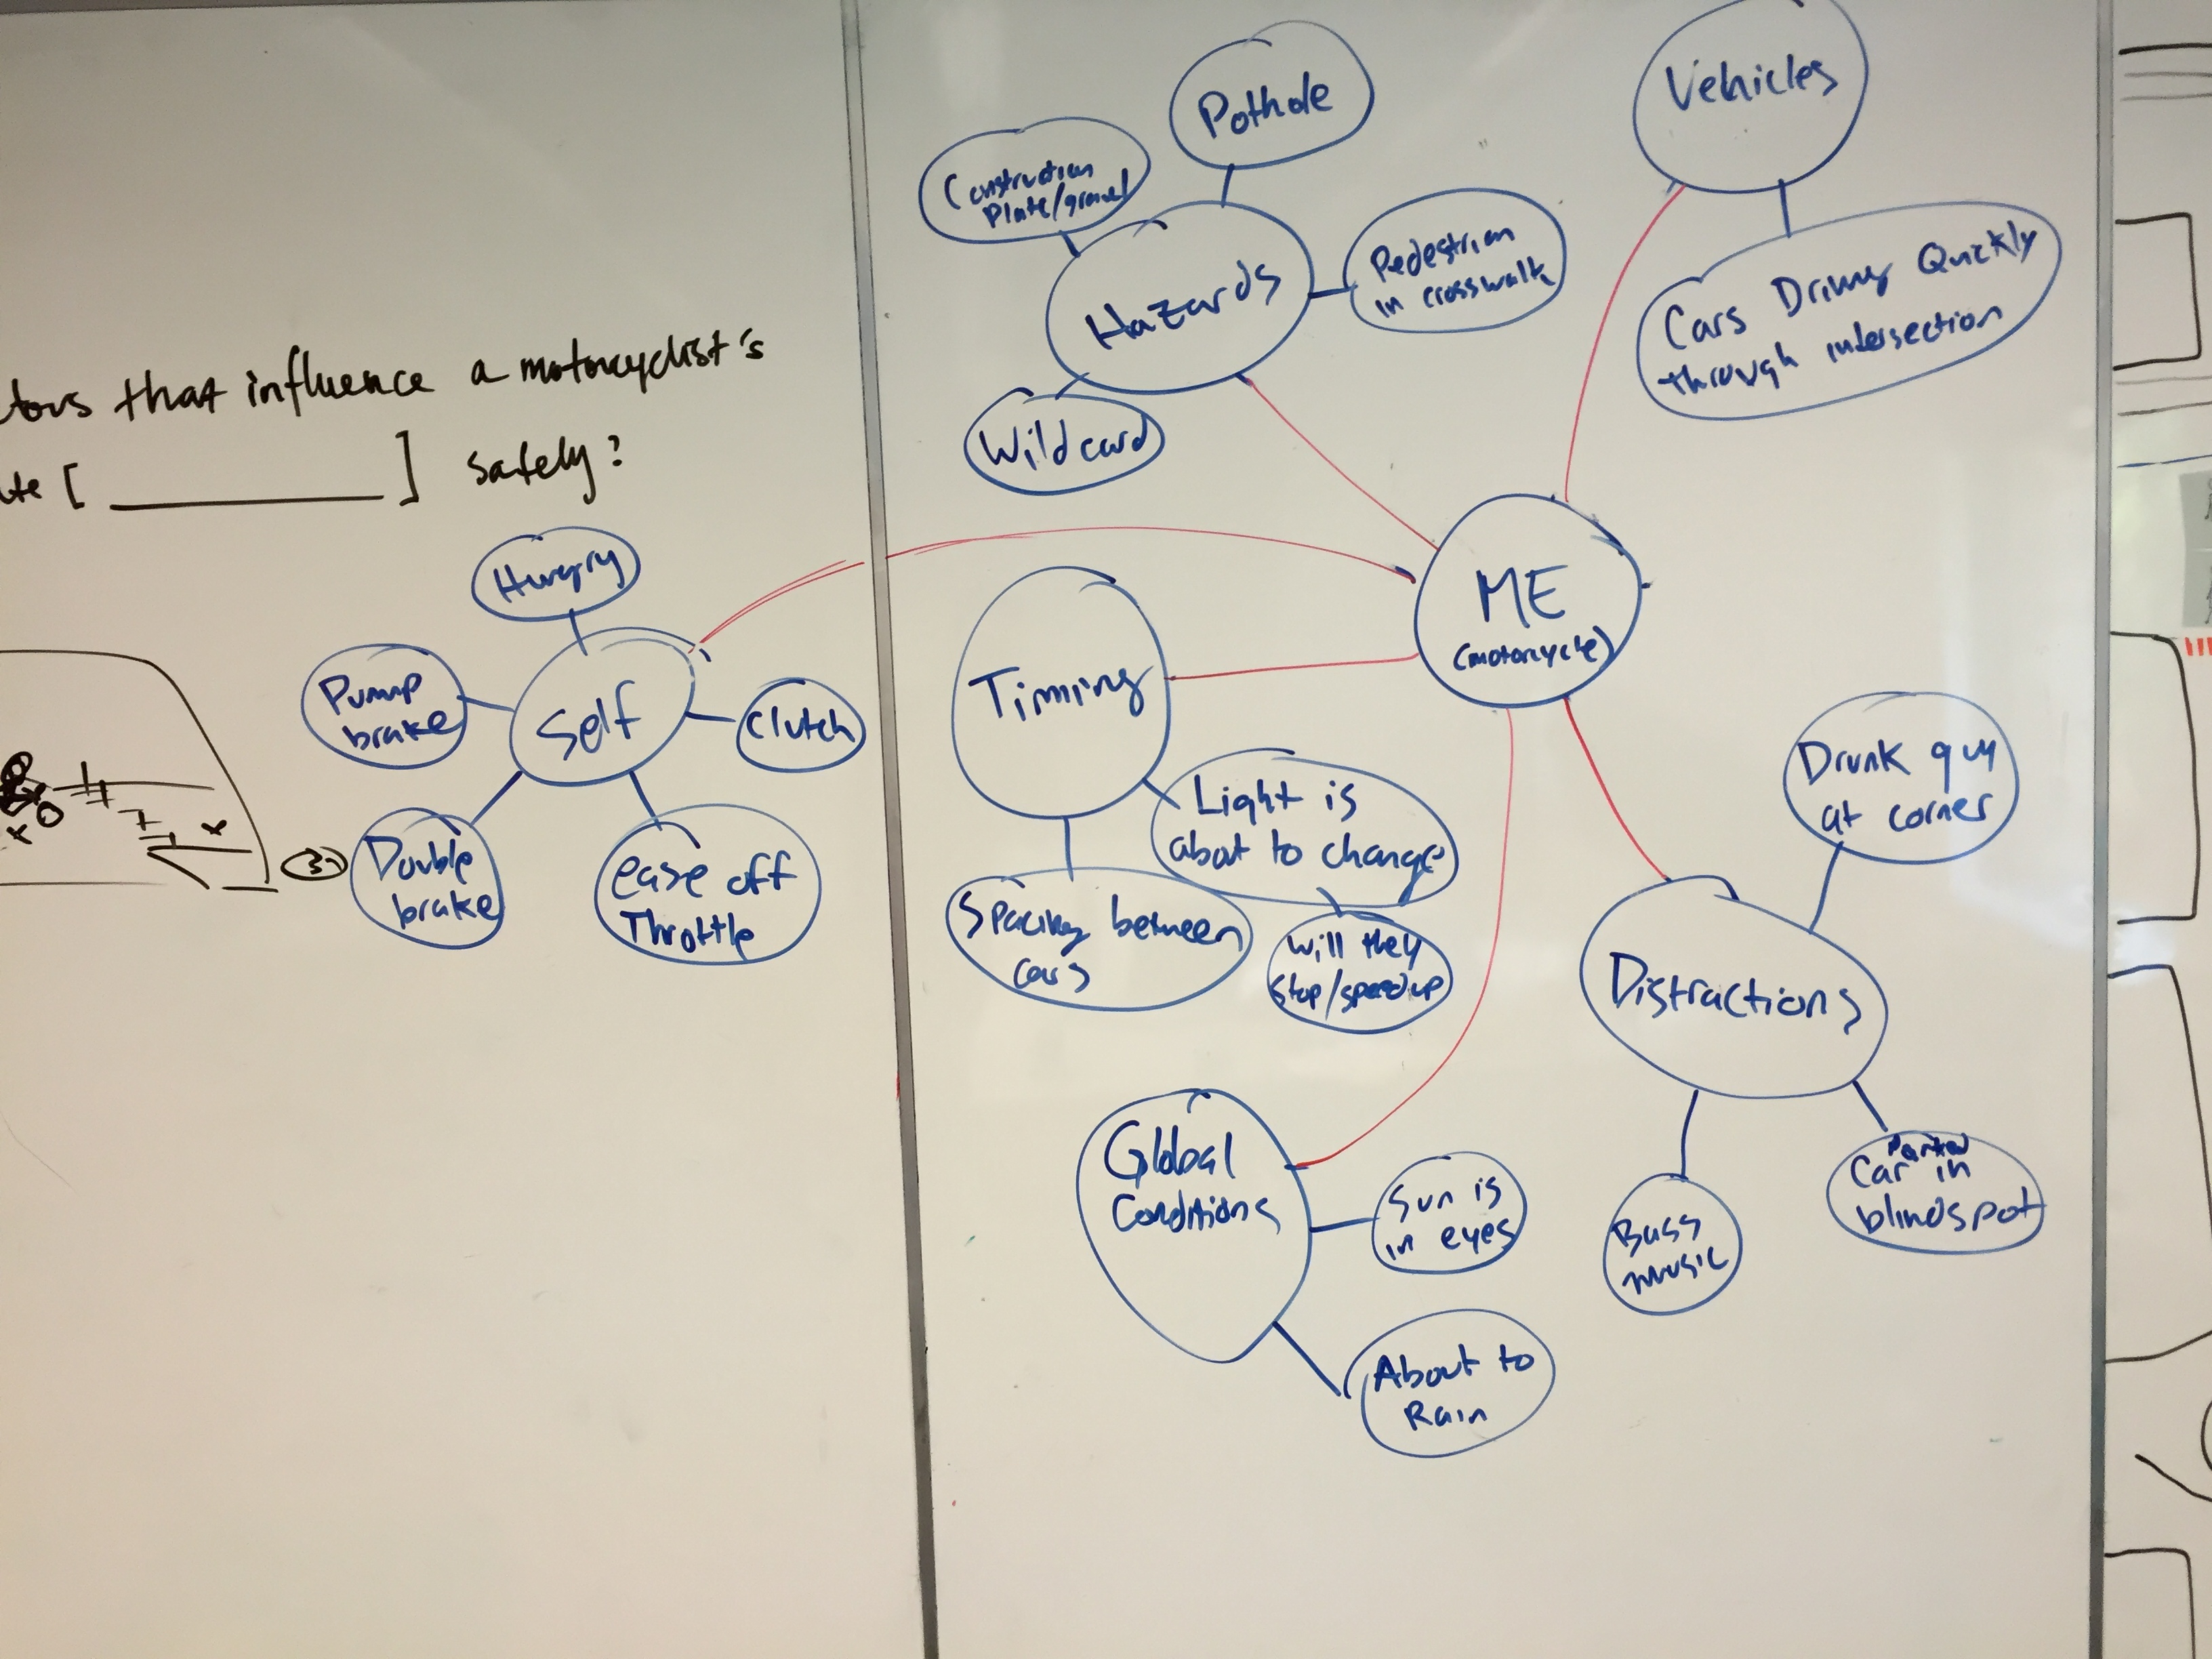
Mindmap of a rider's mental model
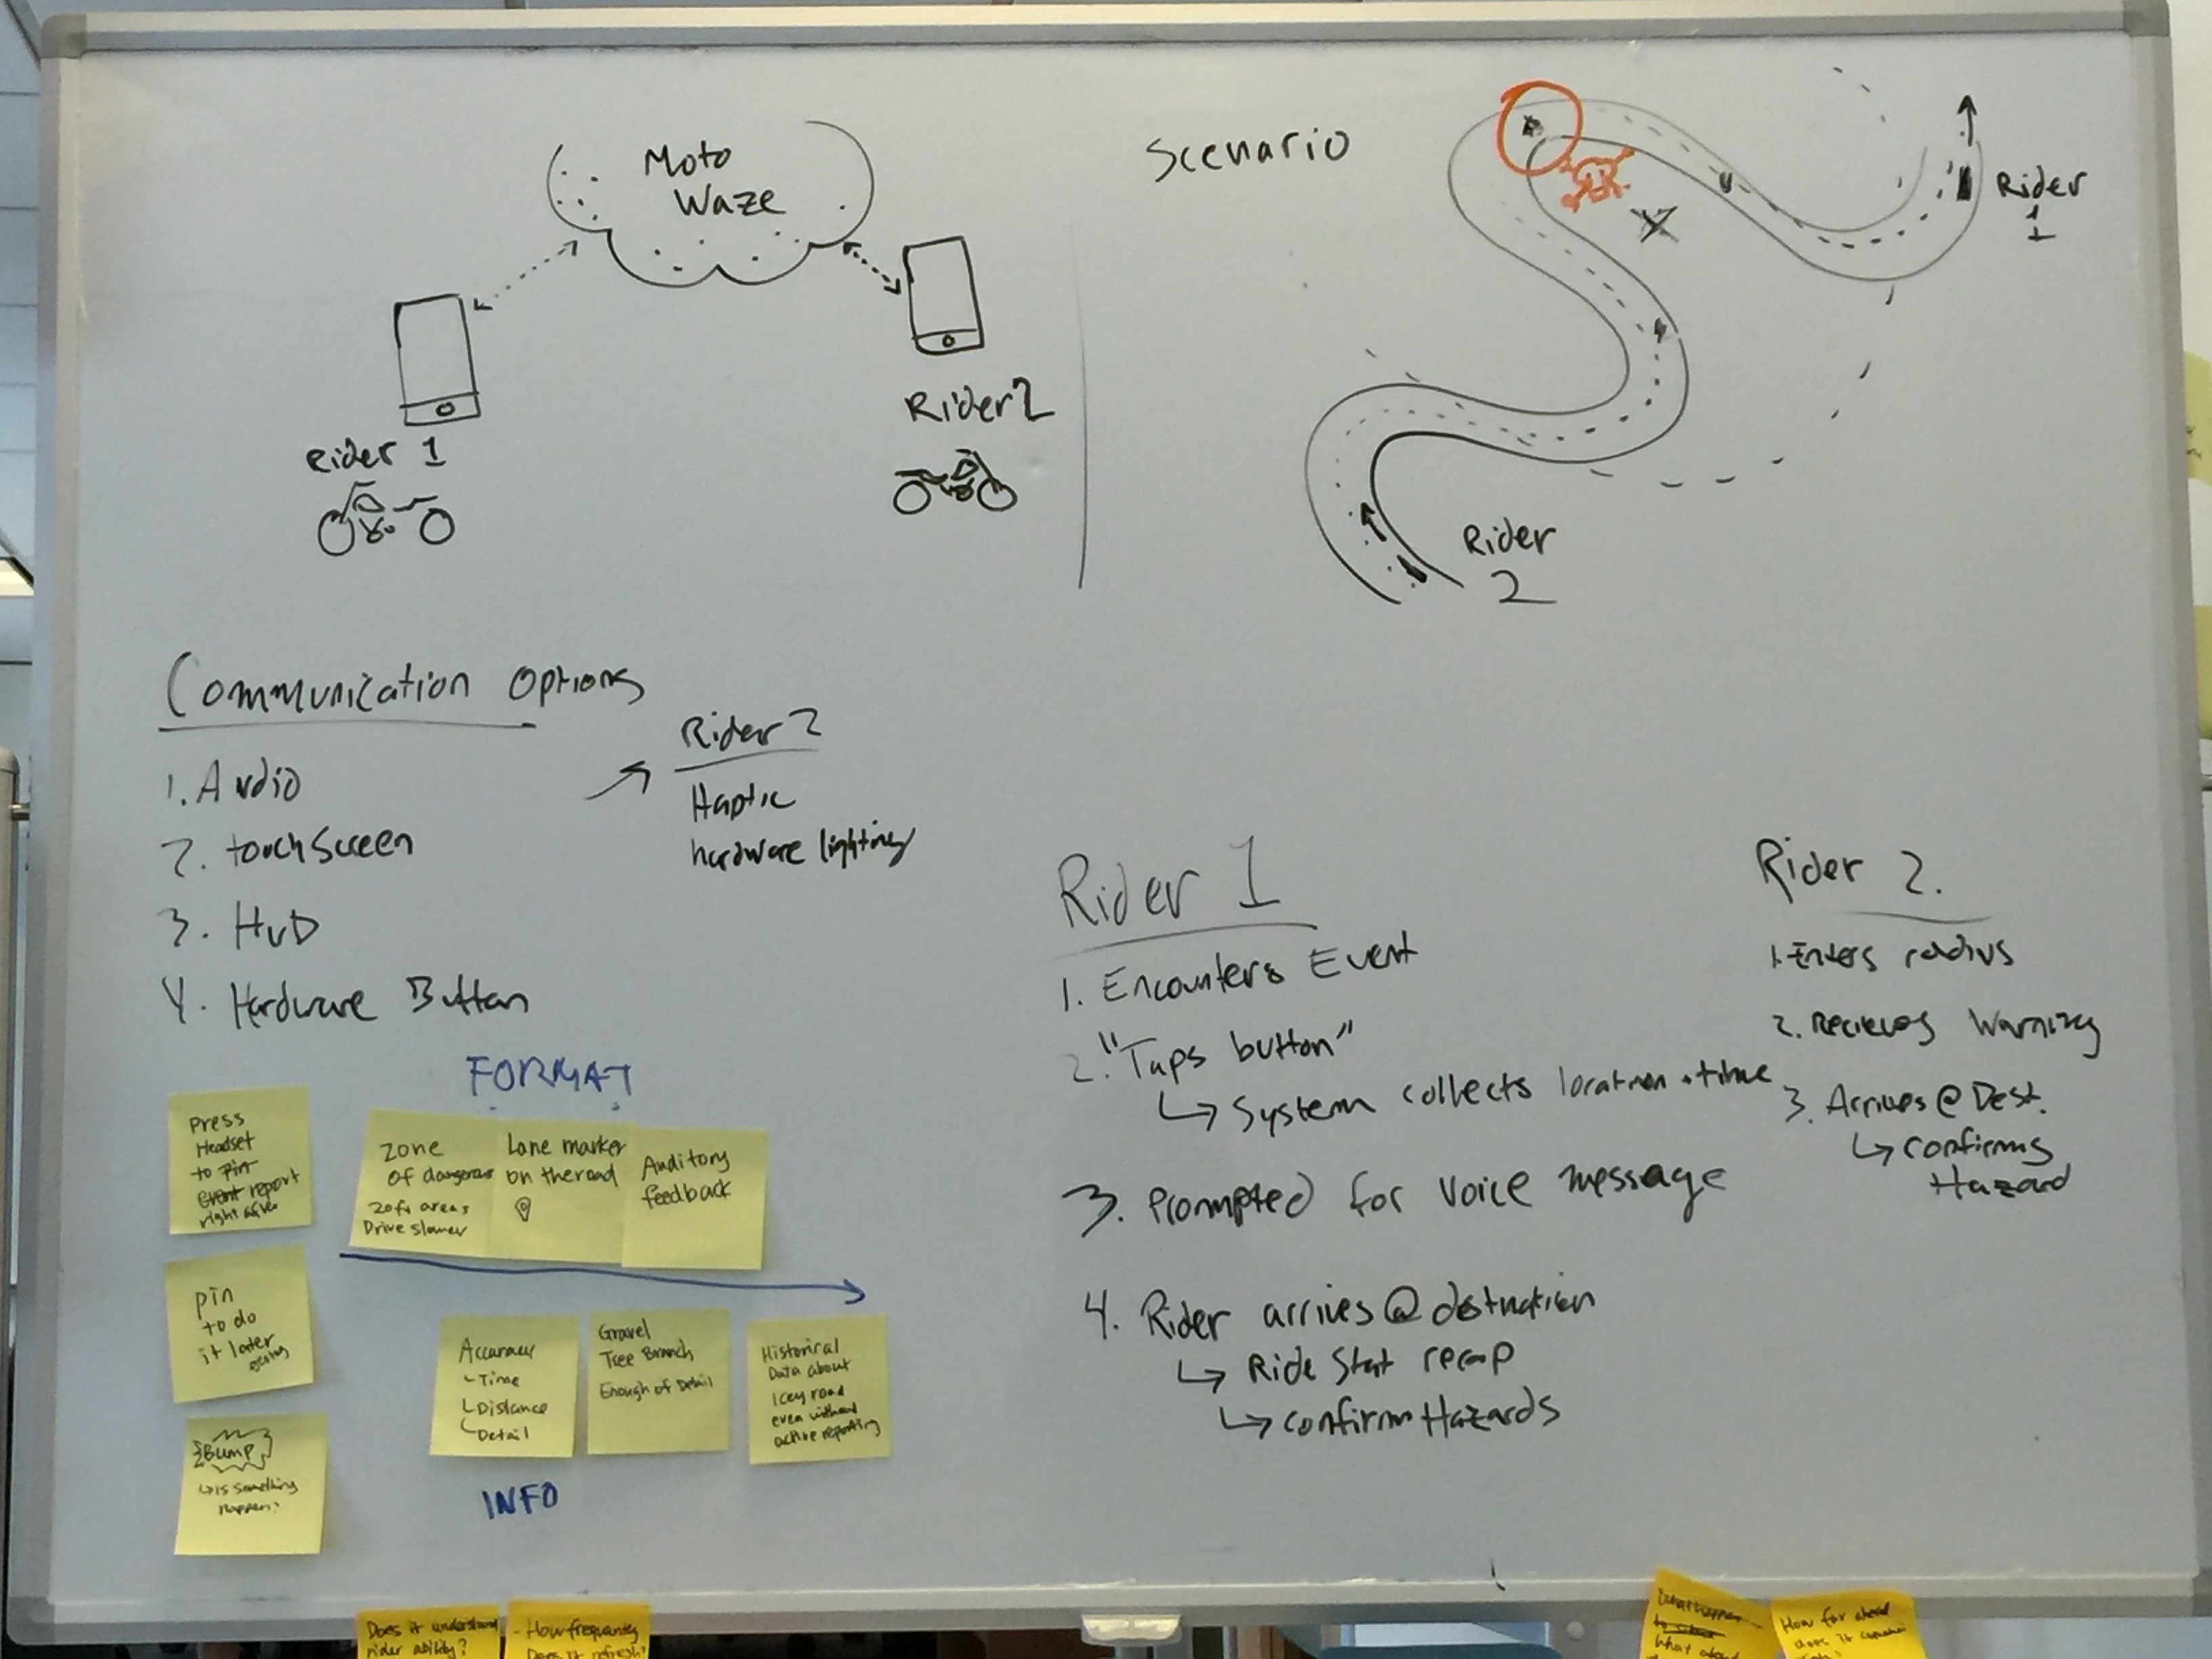
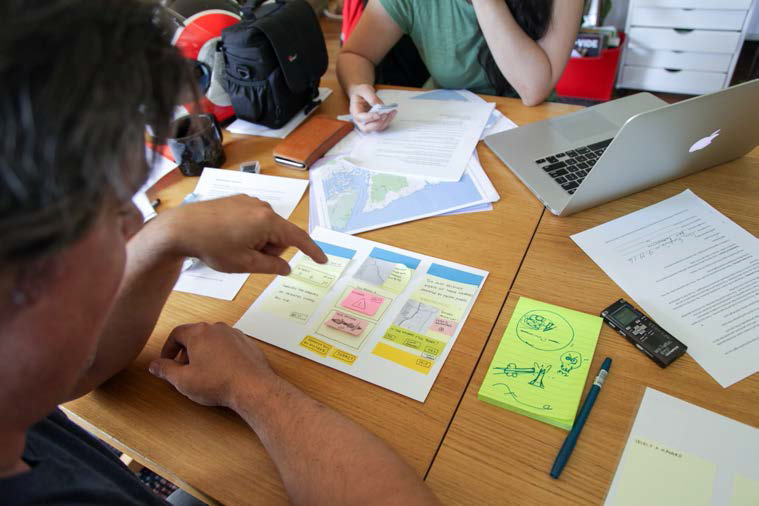
Scenario creation where a rider encounters a hazard
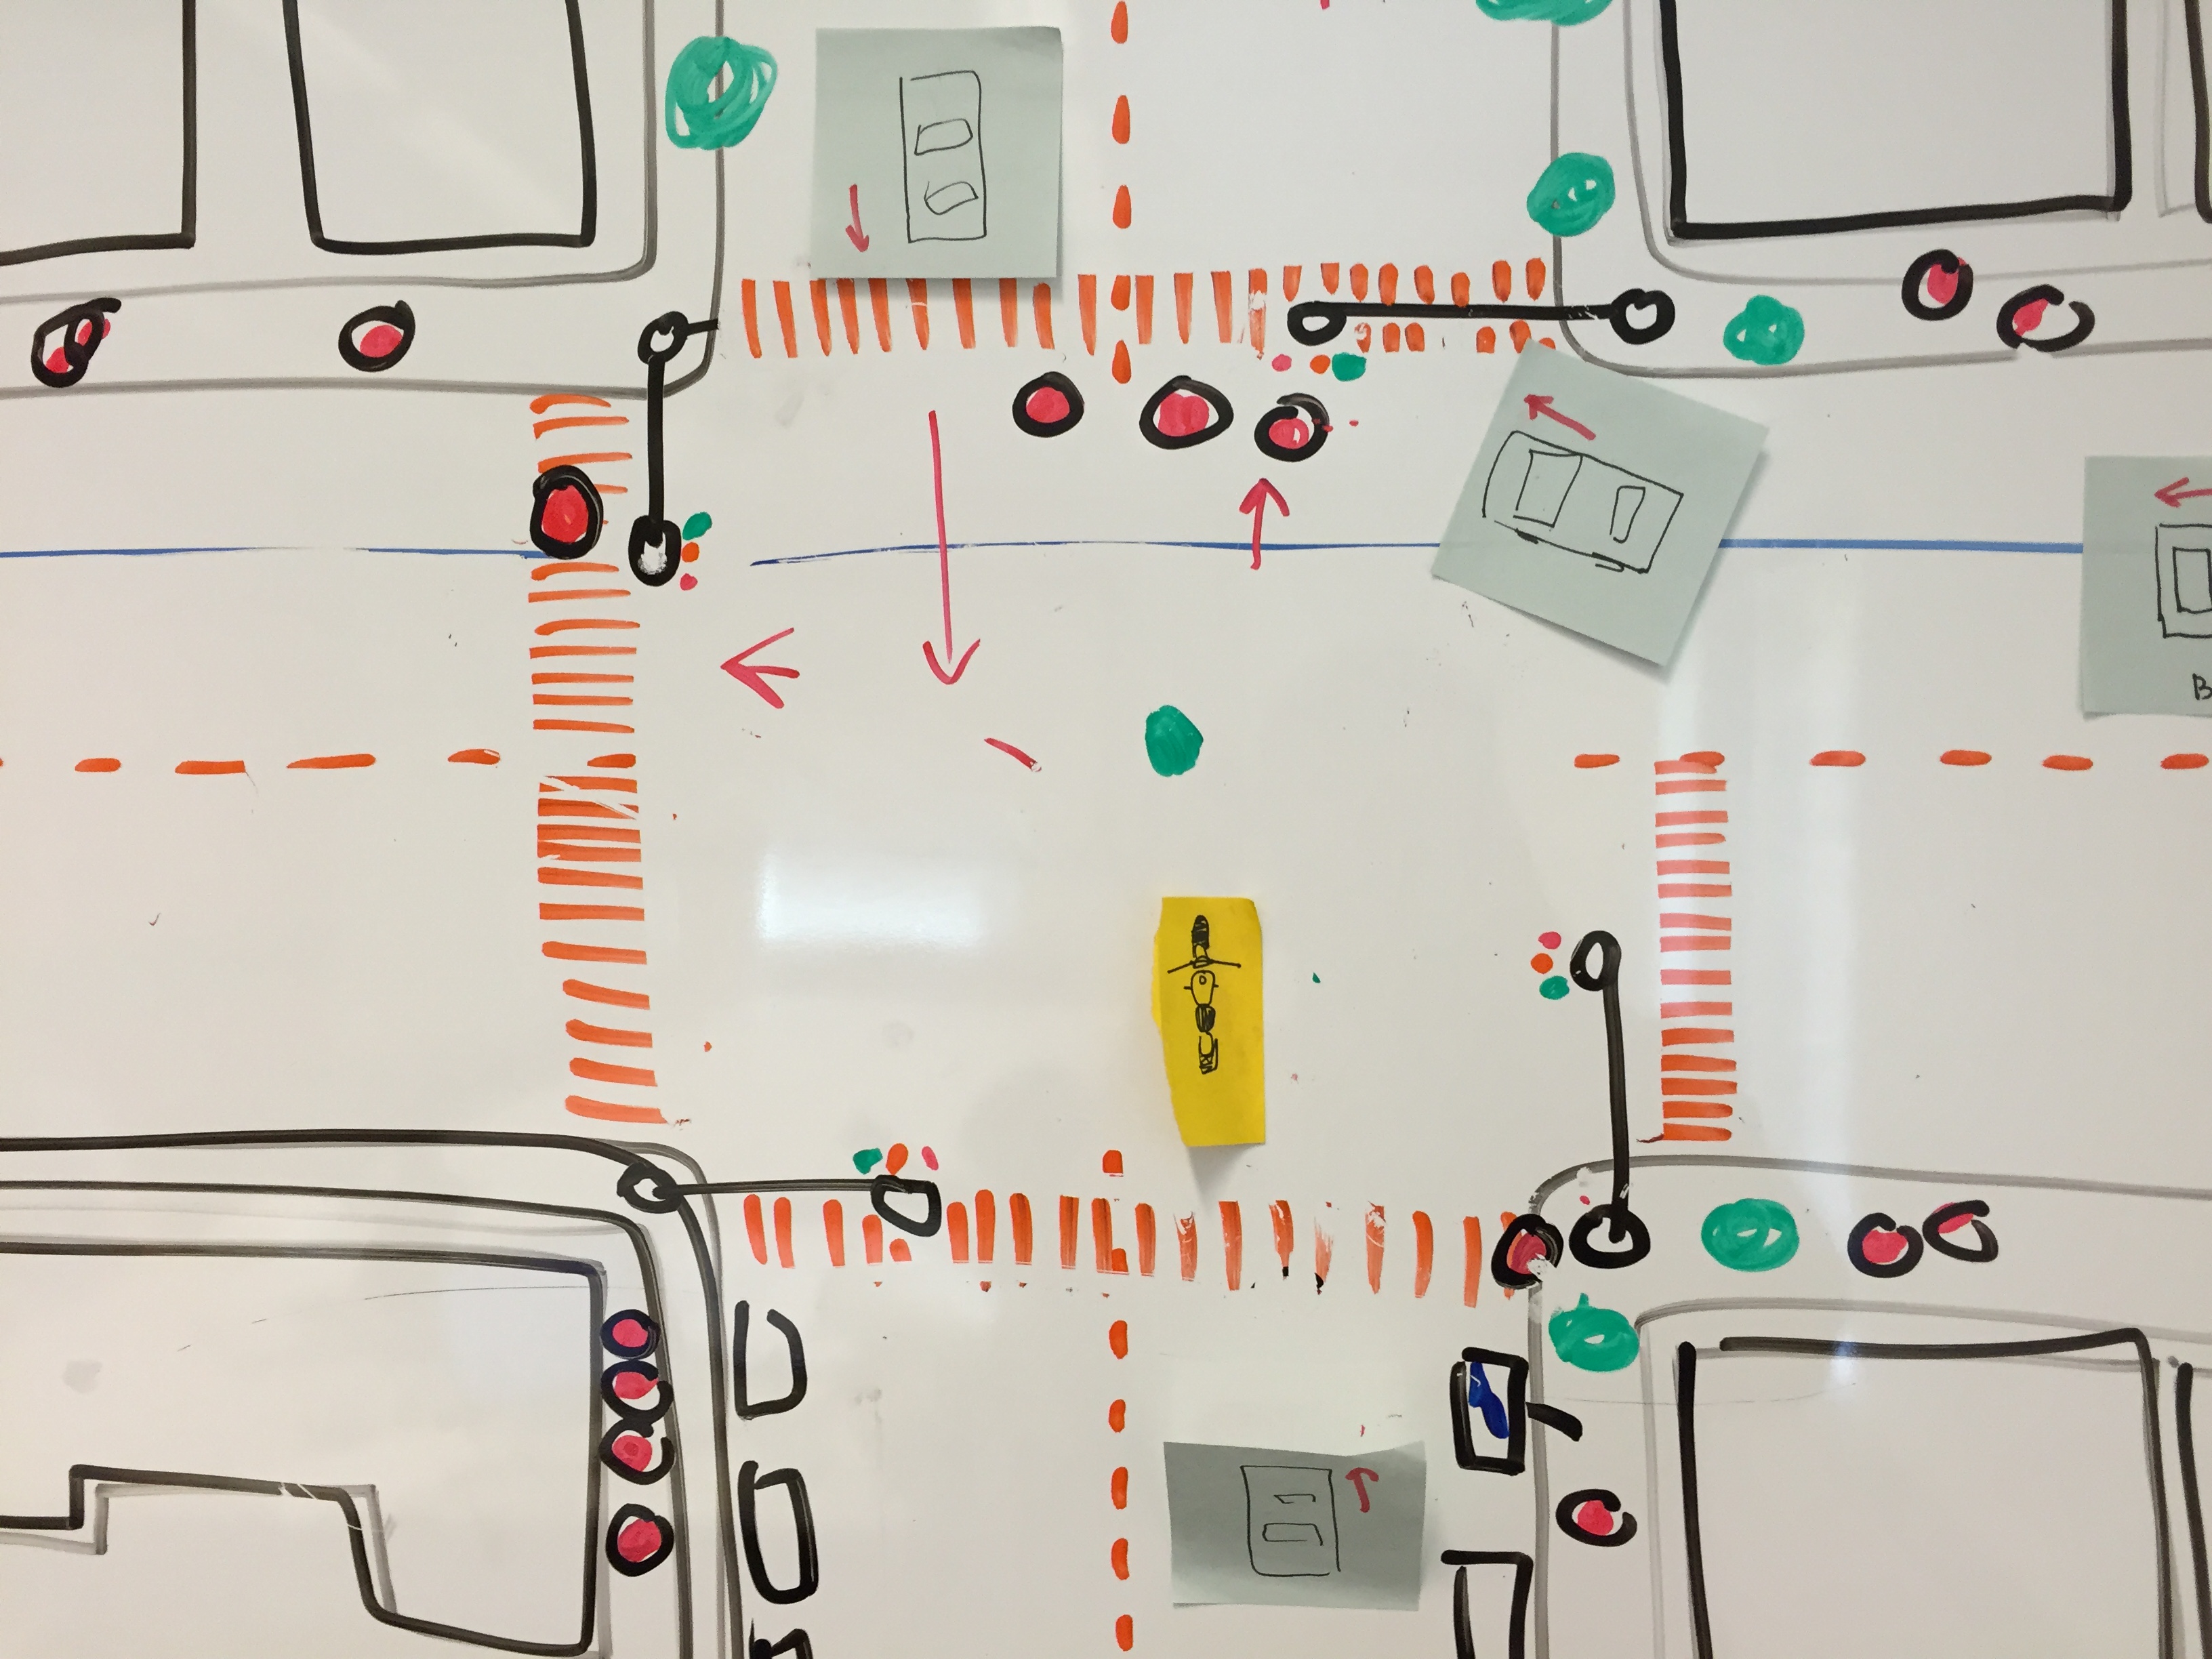
Business origami toolkit of a busy intersection
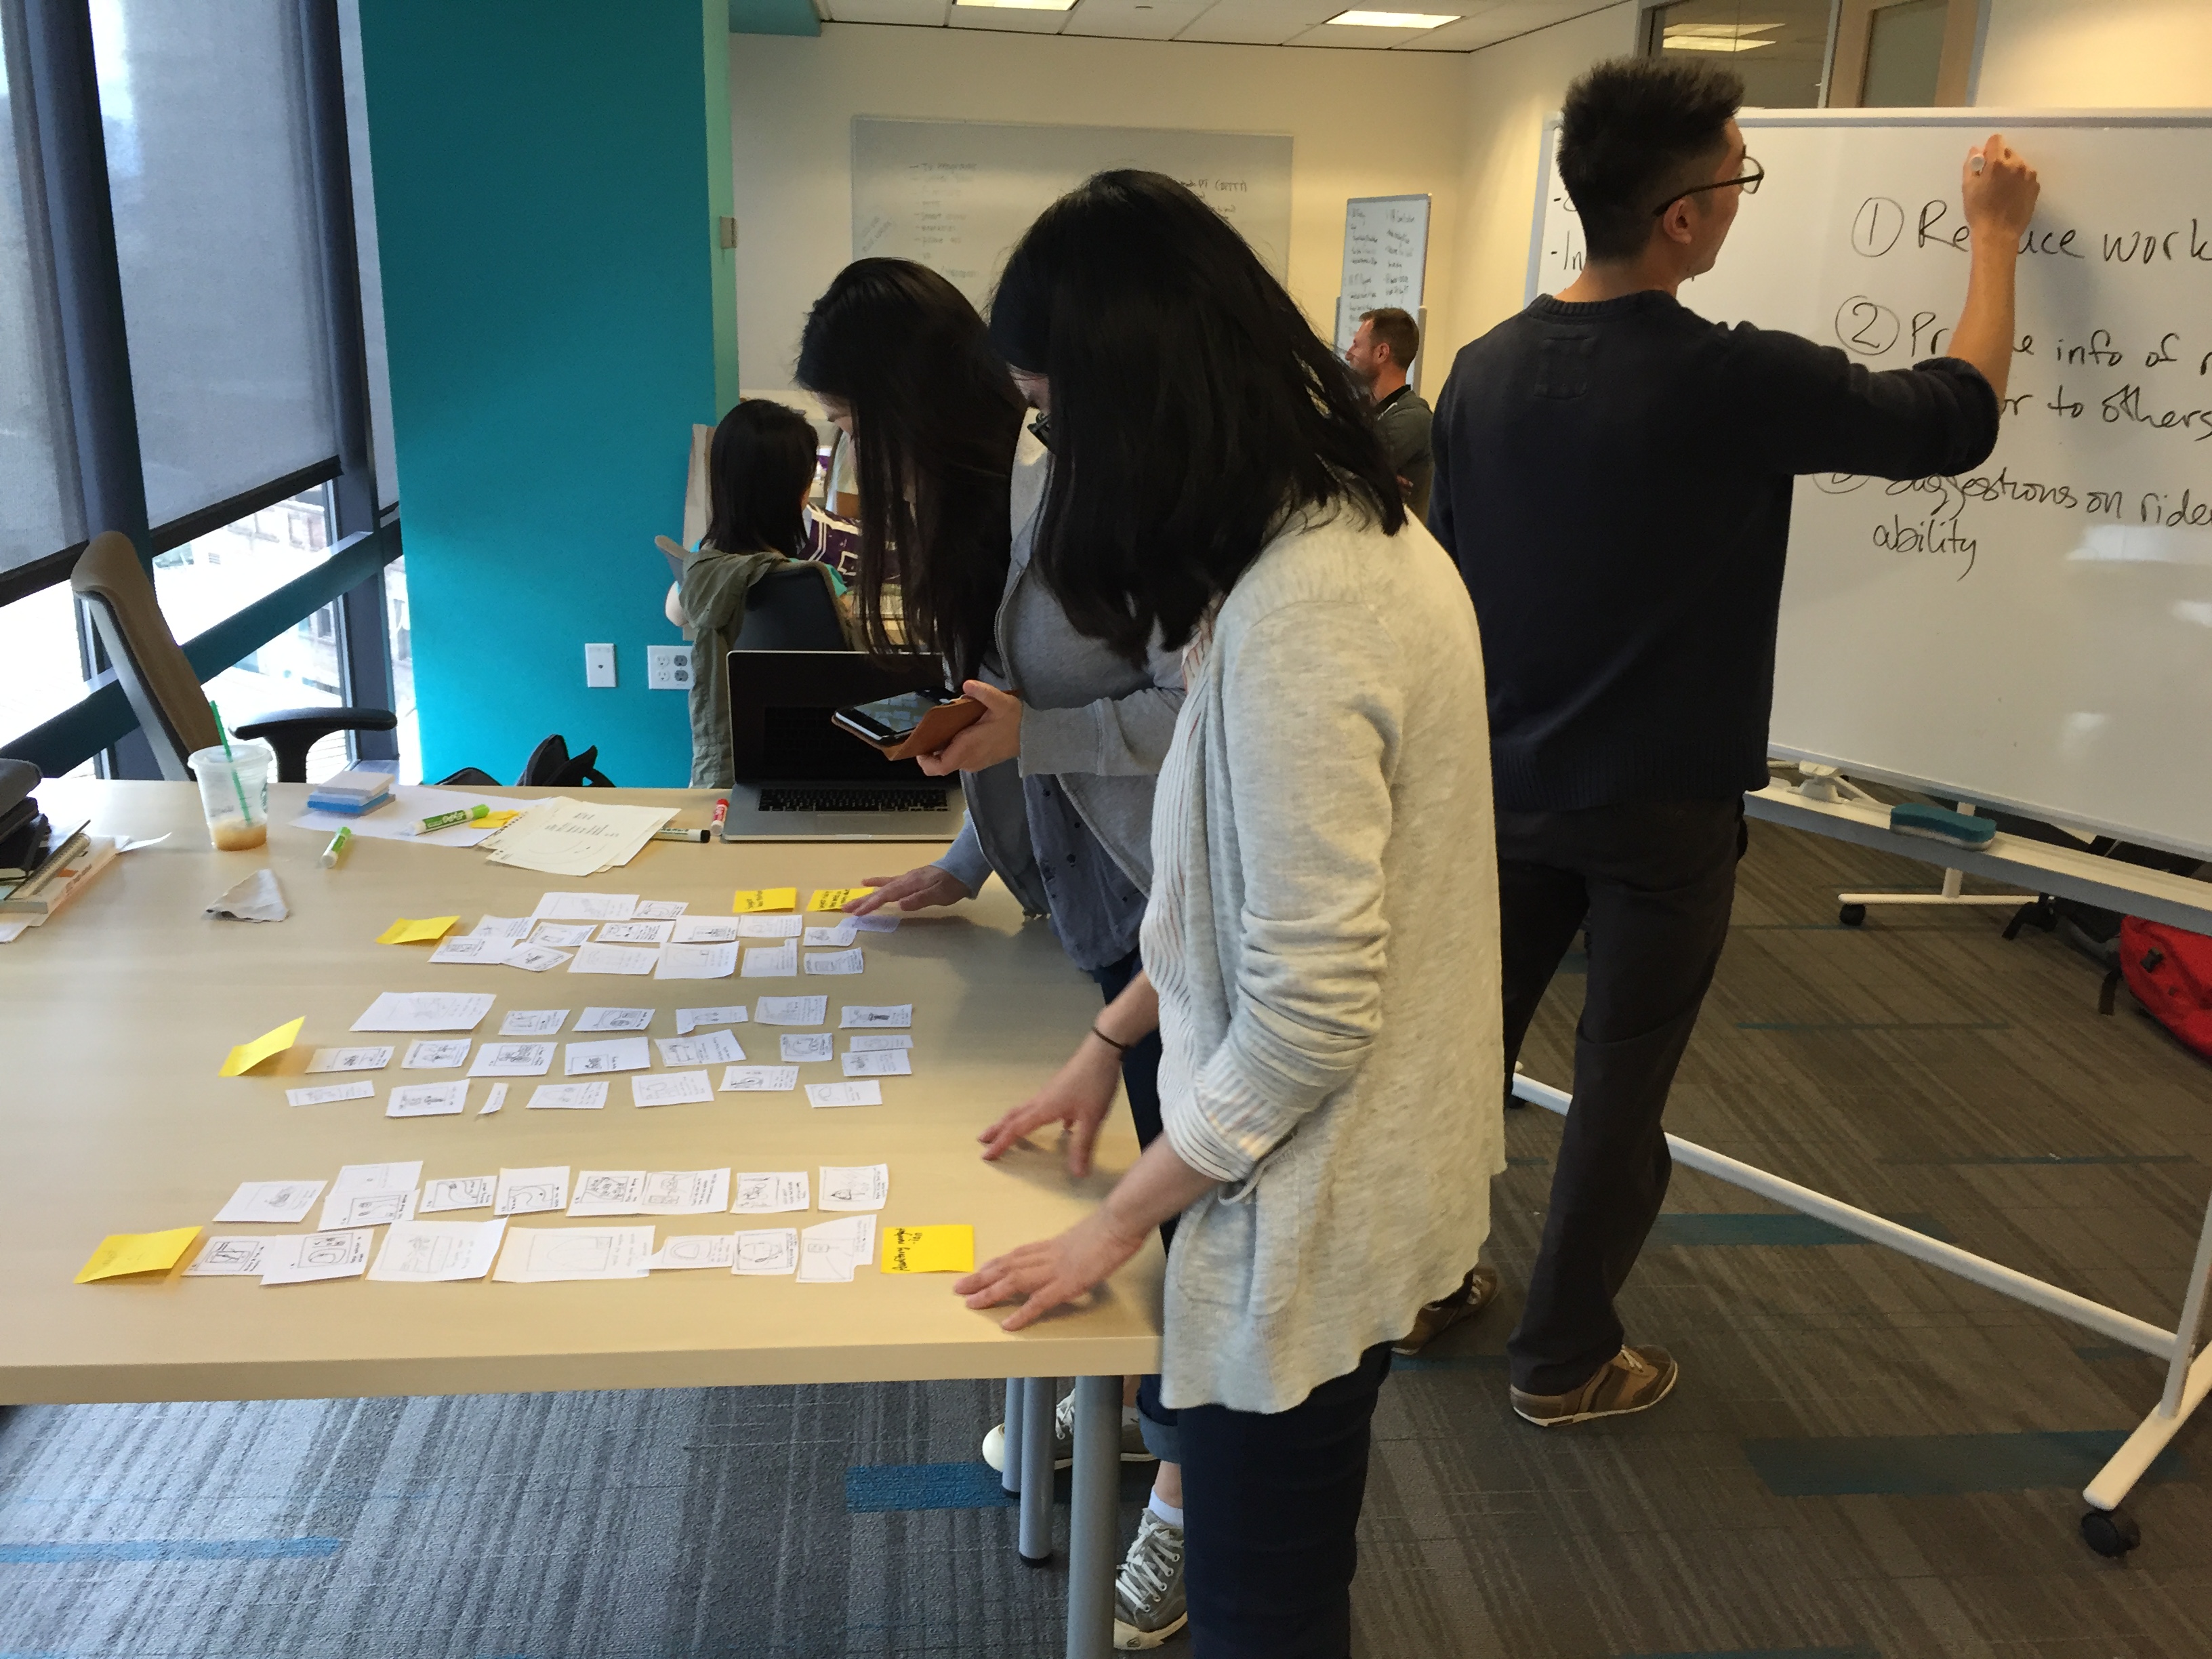
Once the first round of ideation and refinement was finished, we voted on which concepts we liked the best based on the design artifacts generated. The top 5 concepts were selected and then expanded upon through another round of ideation and brainstorming around each concept, exploring what other possible features/affordances they could provide.
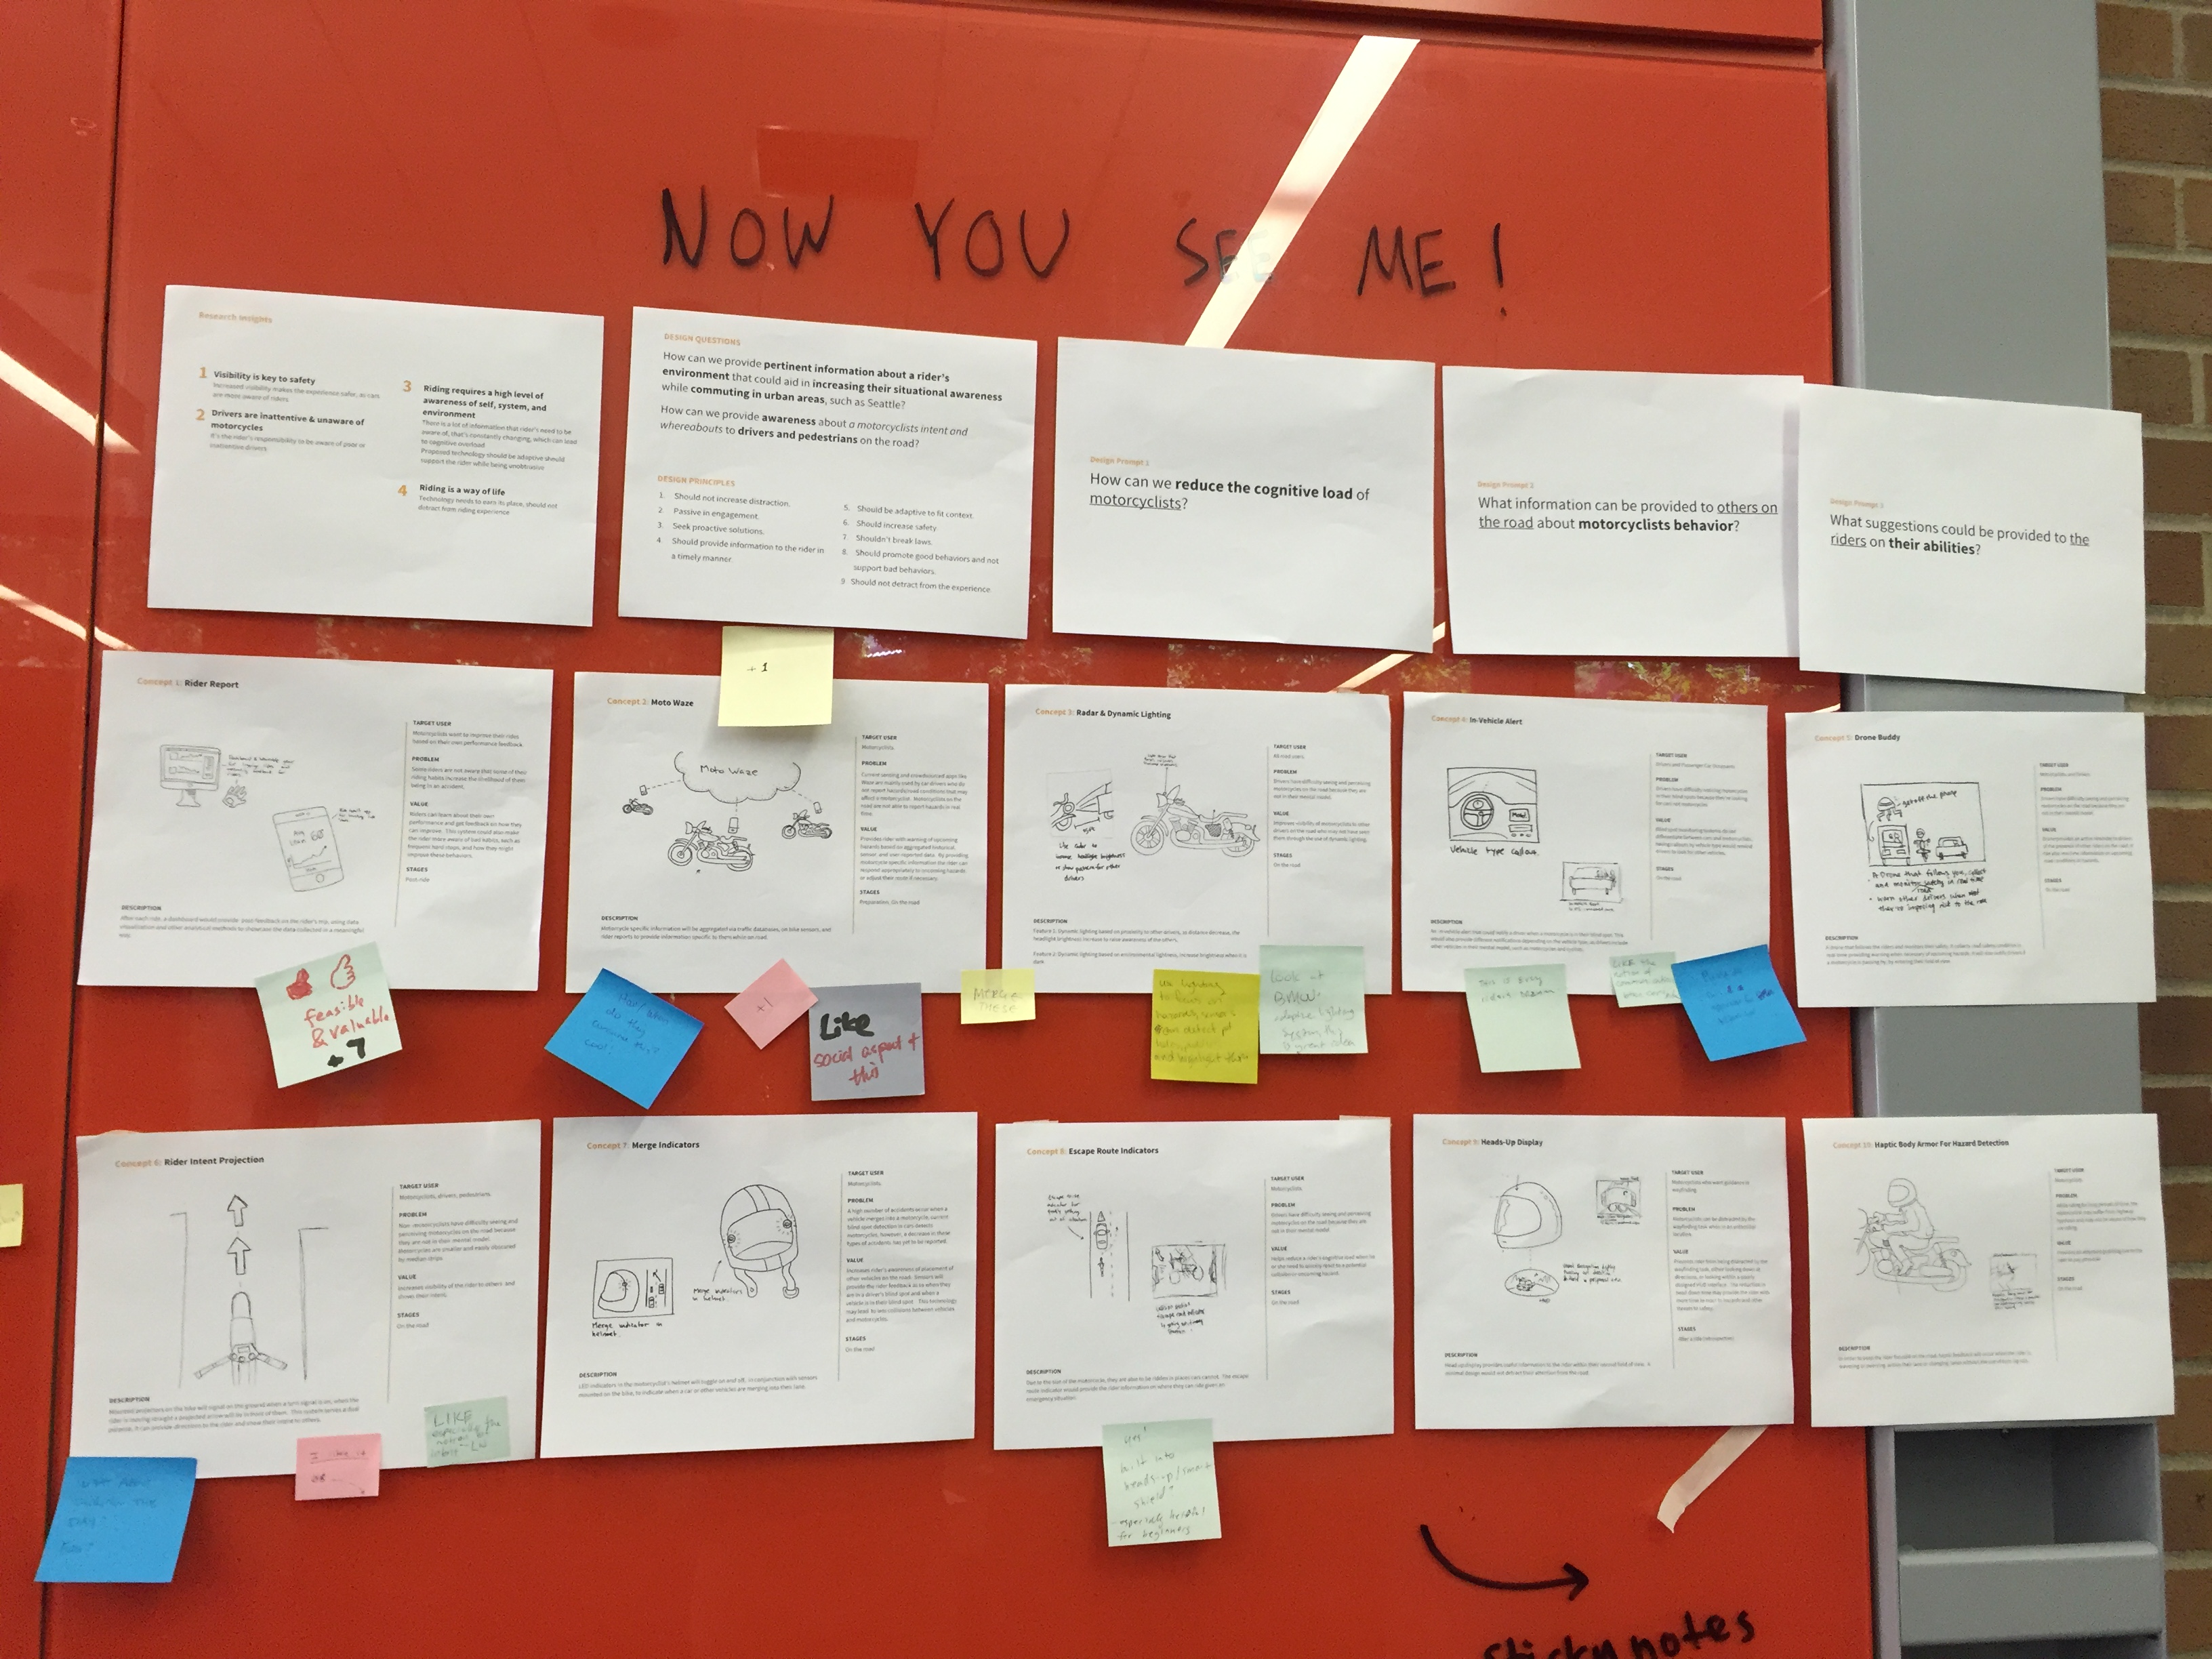
Voting on the concepts
List of features/affordances for one of the concepts
To finalize the concept, we mapped our 5 concepts and the features they could provide to 2 distinct directions using an affinity diagram. One was to increase other motorists awareness of the rider's presence, while ther other was to provide awareness to the rider that allows them to mitigate risks beforehand.
We ultimately decided to go with the second direction, as it's much easier to increase the rider's awareness then it is to increase other drivers, at least until vehicle to vehicle communication is available with 5G and IOT. The concept we ended up picking from this design direction was the hazard alert and reporting system, similar to Waze but catered towards motorcyclists.
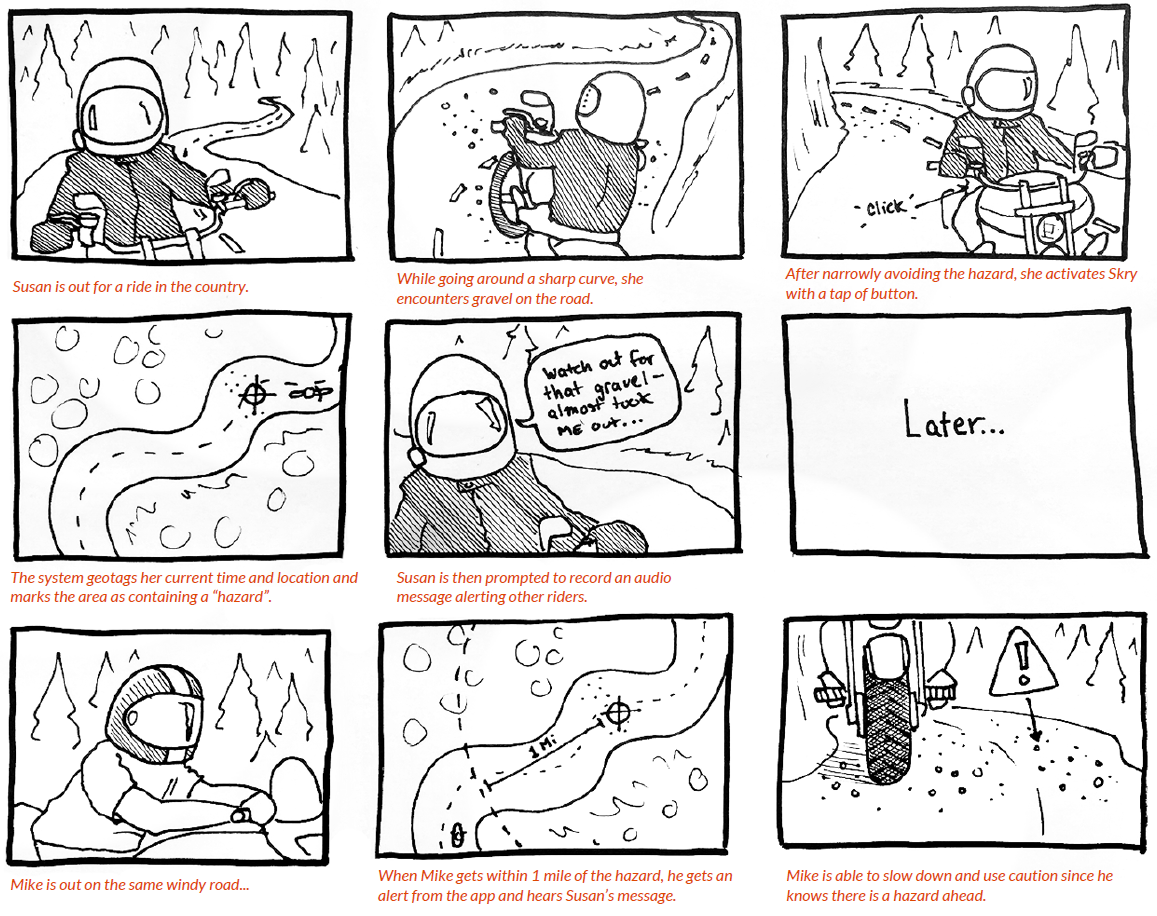
We created a storyboard of our final concept, where the system alerts the rider of upcoming hazards and events through a mobile app connected to a rider's bluetooth headset. The rider would also be able to alert others through a recorded message. While not shown, the rider could also plan their trip and review their post-ride report through the app as well. We decided to call our concept "Skry" as it provides a look into the future.
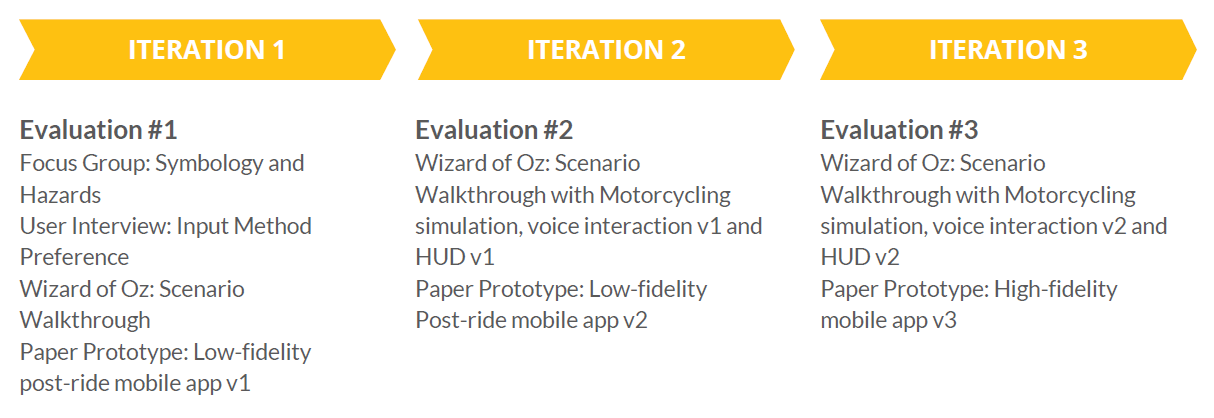
In order to validate our concept, we conducted 3 evaluations. The first iteration focused on building a paper prototype of the mobile app and evaluating the variables that would be used during testing such as iconography, tones, and possible scenarios. The second and third iteration focused on testing the HUD and Voice UI in varying fidelities using wizard of oz prototyping as well as a higher fidelity version of the mobile app.
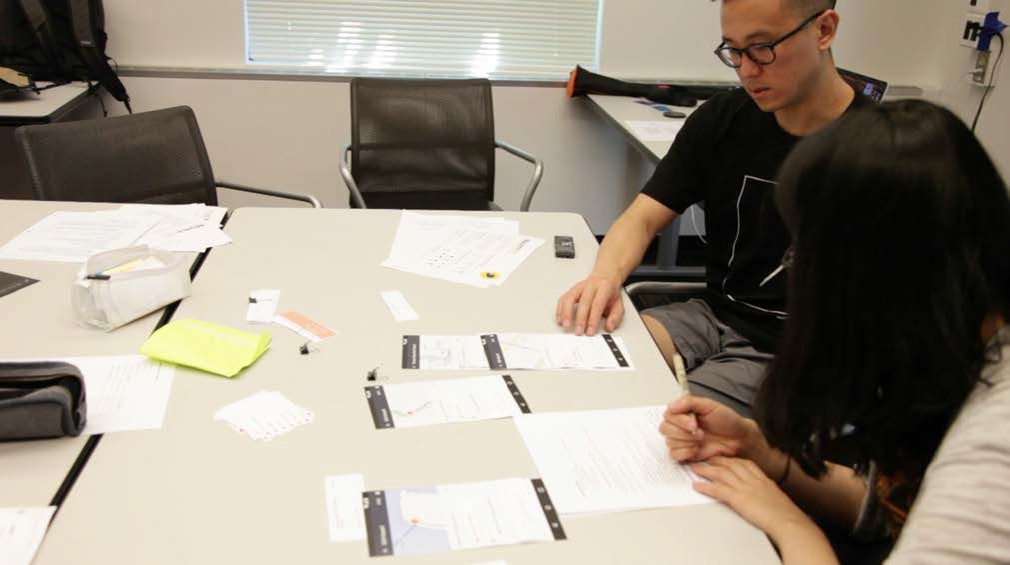
In the first phase of testing we conducted a small focus group with participatory design to learn about road symbology, hazards, and button placement. When discussing symbology and hazards, we presented images to the group and asked for opinions. For button placement, we asked riders to sit on their motorcycle and imagine what it would be like to geo-tag a hazard on the road. We provided stickers and asked them to place it where they believed the button should be placed.
From the focus group, we found that certain standardized icons like fog weren't easily recognizable. Participants also stated they would like to know about issues that already have signage such as construction zones or deer crossing but would likely not report it to others. For button placement, safety and convenience was key, although some suggested using voice activation for riders with bluetooth headsets as it was safer/easier.
The second part of the first phase was testing how users might actually interact with the system while on the road. Participants sat on their motorcycles and the facilitator walked them through a trip between two destinations using the system. Participants were asked to think-aloud during their ride and were told they did not need to report or confirm any event if they did not want to.
1. To simulate an alert for a known hazard, users were alerted with an audible "beep" by the facilitator and presented with an image of an icon, followed by an image of the upcoming hazard.
2. When a crowdsourced message was relayed, the faciliator recited the message and held up an image of the upcoming event. Users were asked to confirm or deny the existence of the event.
3. For a non-reported hazard, an image of the hazard was shown without the auditory alert. If the user wished to report the hazard, they would press a button that was affixed to their motorcycle beforehand.
Following the ride, participants were asked to go through a paper prototype of the mobile app in which they reviewed passed and reported hazards.
Our participants stated they felt good about reporting serious hazards to other riders because it would help others ride safer. They also liked the personalization aspect of hearing someone's recorded message but expressed concerns about not being able to understand the message due to noise/accent. They also wanted additional info such as the length and severity of the hazard. Before hearing a report, they would like it to be validated in some way (i.e. multiple reports). Both users were fine with viewing and confirming their own reports, but not others.
For the second test, we focused on constructing a wizard of oz prototype that would be more interactive, based on feedback from the first user test. Participants would be playing a motorcycle simulation game on an iPad to simulate the cognitive load of riding, and hazards and alert tones would appear in a split-screen view following our test script:
1. Users were first given a brief demo of the system to help onboard them as to how it worked.
2. They were expected to initiate the system we created (Skry) when reporting a hazard, by saying the clutch "Skry report."
3. This was then followed by a confirmation tone, where the user could then record a message of the hazard they encountered.
4. Once the message was complete, the user would then say "Skry end", which was followed by an end tone.
5. When encountering a known hazard, the system would provide an alert tone as the user entered the hazard zone, coupled with a HUD icon of the hazard.
6. For a user-reported hazard, the system would play the recorded message after the hazard alert tone, and display a generic icon on the HUD.
7. After the user exits the hazard zone, they would hear an end tone, and then be prompted after 5 seconds to confirm/deny the hazard with a confirmation tone.
8. Once the ride was complete, the user was asked to confirm/deny hazards through an updated paper prototype.
Motorcycle simulation game on iPad
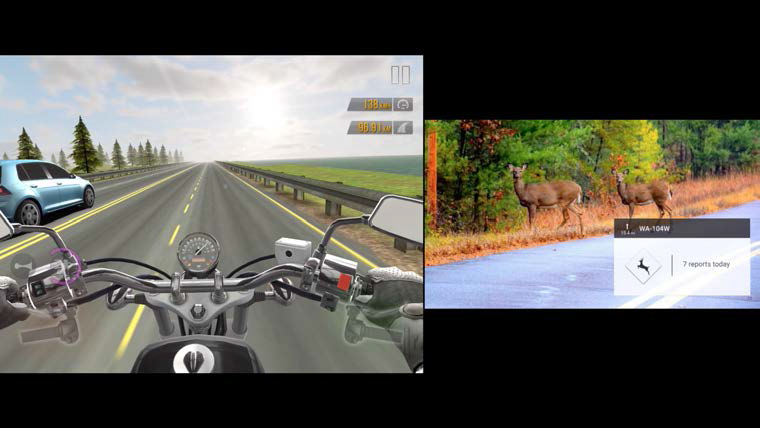
Split screen setup of the game and hazard alert
Low-fidelity paper prototype for post-ride hazard review
Participants liked the idea of a crowdsourced message, but found the voice of Skry to be more trustworthy. We also learned that our riders wanted more information through the auditory channel instead of visually since it was less distracting. Participants did not feel comfortable denying hazards that can often be unseen like the presence of deer. Lastly, participants wanted to be able to see upcoming and newly reported hazards on the route while stopped.
The final prototype evaluation followed the flow of the previous test with a few key differences:
1. We moved from a tonal system to a conversational UI. Instead of hearing an alert tone for an upcoming hazard, the system informs the user through speech.
2. When the participant says "skry report", skry responds back with "state hazard and location" to get more standardized responses.
3. Natural language processing was used so all crowdsourced messages were parsed for keywords which were relayed to the rider in lieu of the real message.
4. More functionality was added to the paper prototype so that riders could input their destination, preview upcoming hazards, and choose a route.
5. Finally, we moved from a splitscreen view to an overlay of the HUD onto the motorcycle game using dual projectors which was more realistic.
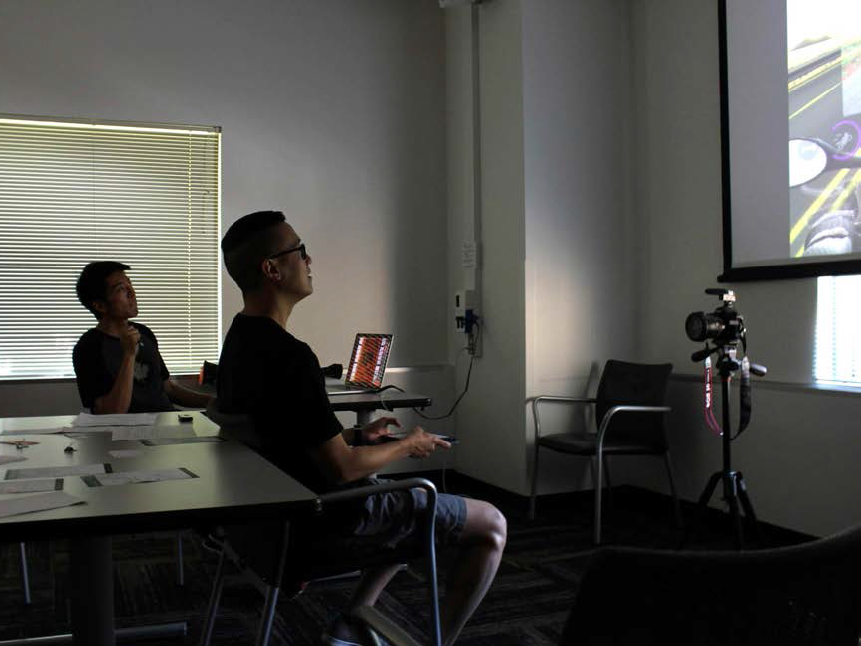
Motorcycle simulation game on iPad
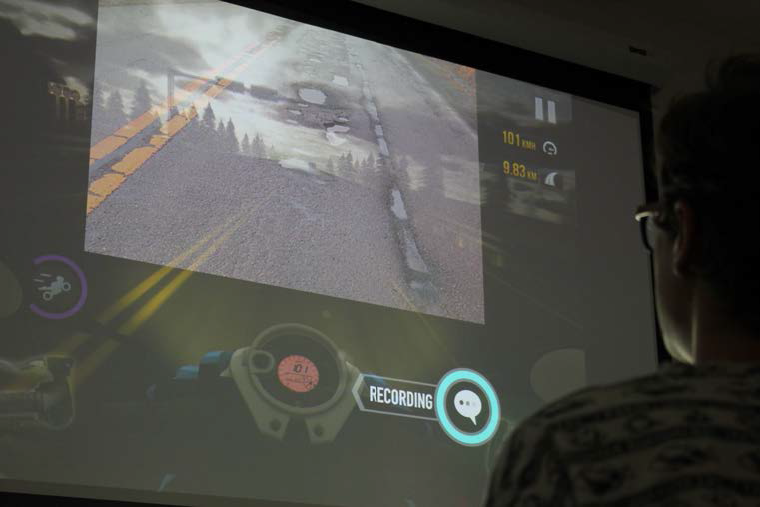
Projection of the HUD overlayed with the simulation
High-fidelity paper prototoype for pre- and post-ride mobile app
We found that when users were reporting a hazard, they did not always know how to answer the question regarding the hazard location such as what side of the road it was on. Improvements would have to be made to the question itself or a tutorial could be added so that users were clear what "location" meant. We also learned that users wanted to be able to report points of interest and learn more about good routes nearby.
Fueled through the Skry mobile app, Skry allows riders to plan their route, search for points of interest, and view/report real-time hazards. Traffic, weather, and accident data will be integrated using the Connected Citizens Program to get information from municipal providers such as Waze and Inrix. This will help provide riders more accurate information besides user reported incidents. All information is uploaded to a centralized server to avoid duplicate entries in the system.
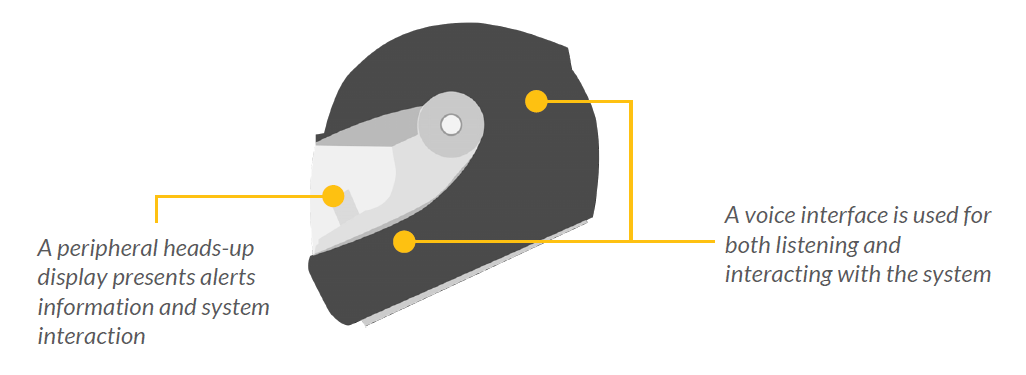
Unlike most systems currently available, Skry utilizes an entirely hands-free approach, allowing the rider to simply speak and the system listens. This is a focal aspect of our system, as pre-existing systems focused on a combination of touch and voice interaction, which leads to cognitive overload. This is especially true for dangerous situations where the rider wants to avoid taking their hand off the wheel after being alerted of an upcoming hazard.

While the primary mode of interaction is through a voice interface, a secondary HUD provides supporting information to the rider so they don't need to take their eyes off the road. The final component is the mobile app, which is used to connect the rider to the Skry system. It will sync with the HUD and speakers in the helmet through bluetooth. During the ride it will play a passive role to avoid distracting the rider. It can also be used post-ride to view a trip report or confirm/deny encountered hazards.
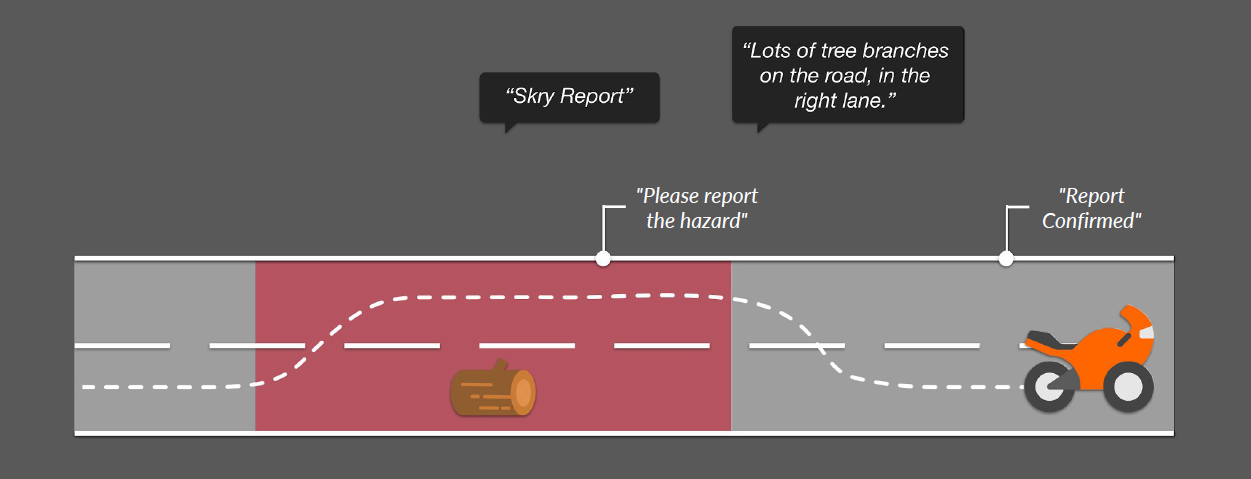
When the rider encounters a hazard to report, they will say "Skry Report," which places a geotag at the location within a 1/2 mile radius to create a hazard zone. The system will prompt the user to record a message, stating "Please report a hazard." This will be accompanied by a visual cue in the HUD, which will consist of a microphone icon to indicate the system is listening/recording.
The rider will then record a message, which will be parsed for key terms using NLP to form a concise message for the next rider. For example, if the rider says, "lots of tree branches on the road, in the right lane," the system would know to classify tree branches as debris. Once the message has been recorded and 2 seconds have elapsed, Skry will state "Report Confirmed."
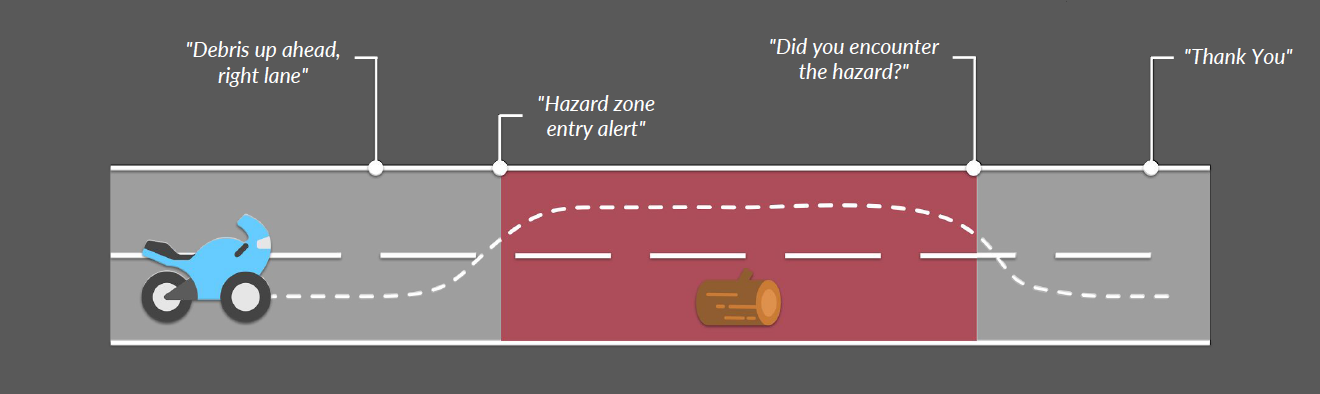
Following the previous scenario, when another rider comes along, they will receive the message "Debris up ahead, right lane" a half mile before entering the hazard zone. They will then receive another warning when they enter the hazard zone through an auditory alert and visual cue in the HUD. We chose this order so users had time to process the message and prepare a mitigation strategy.
As they exit the hazard zone, the visual cue will disappear and they will be asked "Did you encounter the hazard?" This is to confirm whether the hazard is still there, as many hazards are time-dependent. If the user chooses not to confirm/deny, the system assumes the hazard is still there. Once the feedback is received, the system replies by saying "Thank You."
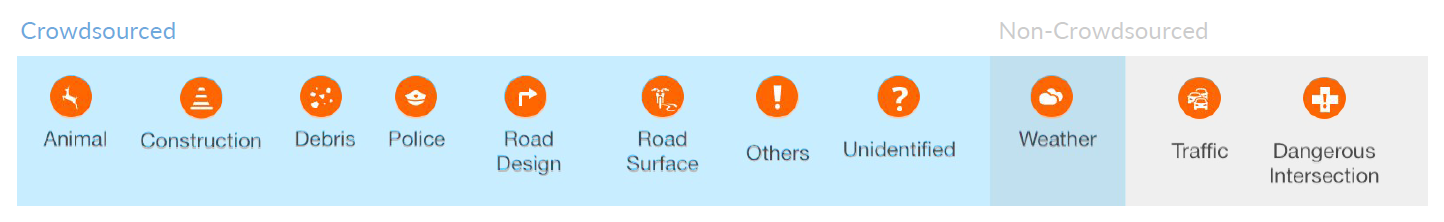
We created a taxonomy to categorize crowdsourced hazards into 7 categories based on research done by Jenkins and Young (2016). A set of predefined hazards within each category will be inputted to the system to help the rider identify hazards quickly. For example, gravel, rock, or sand on roads are all categorized as debris since the mitigation strategy is the same.
We also included categories that can be relayed to the riders but aren't necessarily crowdsourced. For instance, alerts about dangerous intersections could come from accident records or city planning database, while information about traffic and general weather conditions are based on external data providers.
We also considered the data quality in terms of time. One of the challenges that our design encountered was the issue of duplicated records. For instance, when multiple riders report the same hazard but geotag it in different locations. Then riders would have multiple alerts for the same hazard which would be annoying and dangerous. To avoid this, we generated a half-mile radius when geo-tagging. If the same hazard was reported within the established hazard zone, then the radius was increased and the reports were merged.
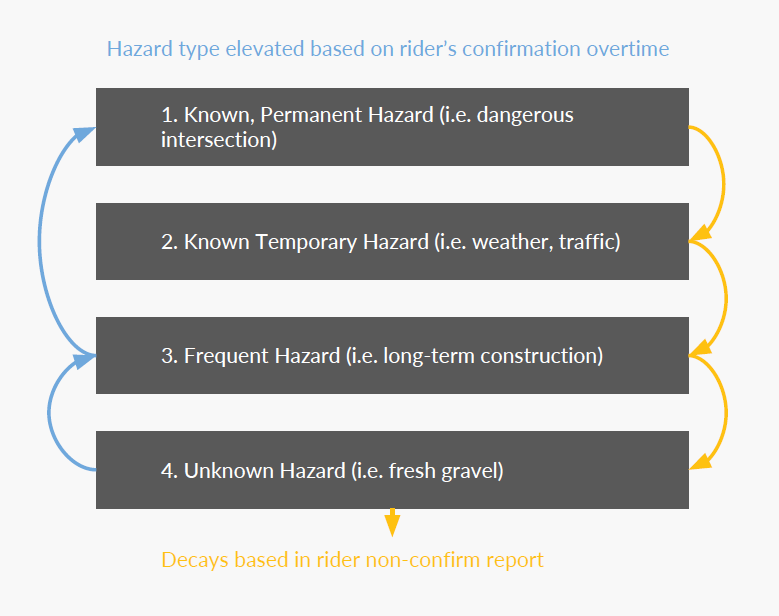
As a result we came up with a hazard decay model, which would elevate or decay hazards based on frequency and duration. Hazards were first classified as unknown hazards which came from user-reported hazards, while known temporary hazards came from external databases. As more and more users reported and confirmed unknown hazards, they became frequent hazards, and eventually known permanent hazards. Hazards would gradually decay and be removed with time, unless enough users confirmed the hazard was no longer there.
In order to process the recorded message into a coherent format, we created a voice interaction model with 3 phases: speech recognition, natural language understanding & management, and system feedback.
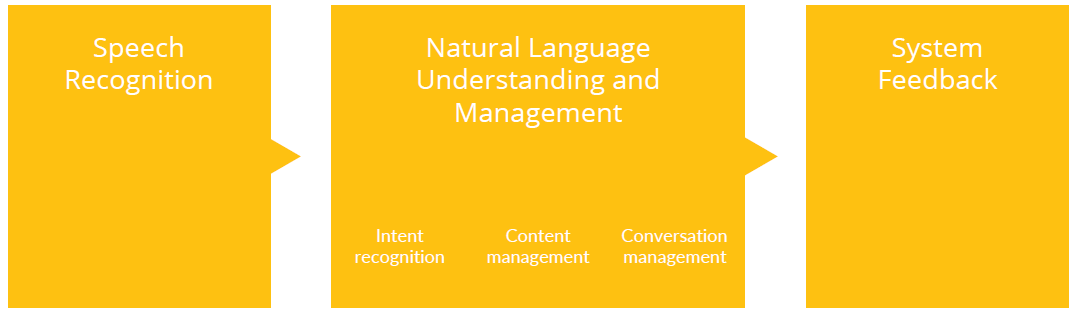
Speech recognition is commonly seen nowadays with platforms like Siri or Alexa, which require a clutch word to activate the system like "Skry." Next is the actual processing of a user's speech which is broken up into three steps:
1. First it requires an agent that will be able to recognize the intent of the user. For instance, if a user wants to cancel a command, the agent will have to discern the context of the command and take the appropriate action.
2. Then the system will have a model that will classify different keywords in the message into the different hazard categories. The classifier would be trained with the Waze dataset first to improve accuracy before moving onto rider data.
3. Last is conversation management which Waze lacks. It reads out a list of commands, while our system allows the user to record a message. The post-ride app allows users to re-classify hazards misinterpreted by the system.
After the system has processed a user's command, it provides system feedback to confirm it has successfully processed the command. Our system provided a visual cue through the HUD as well as an auditory reply or alert tone.
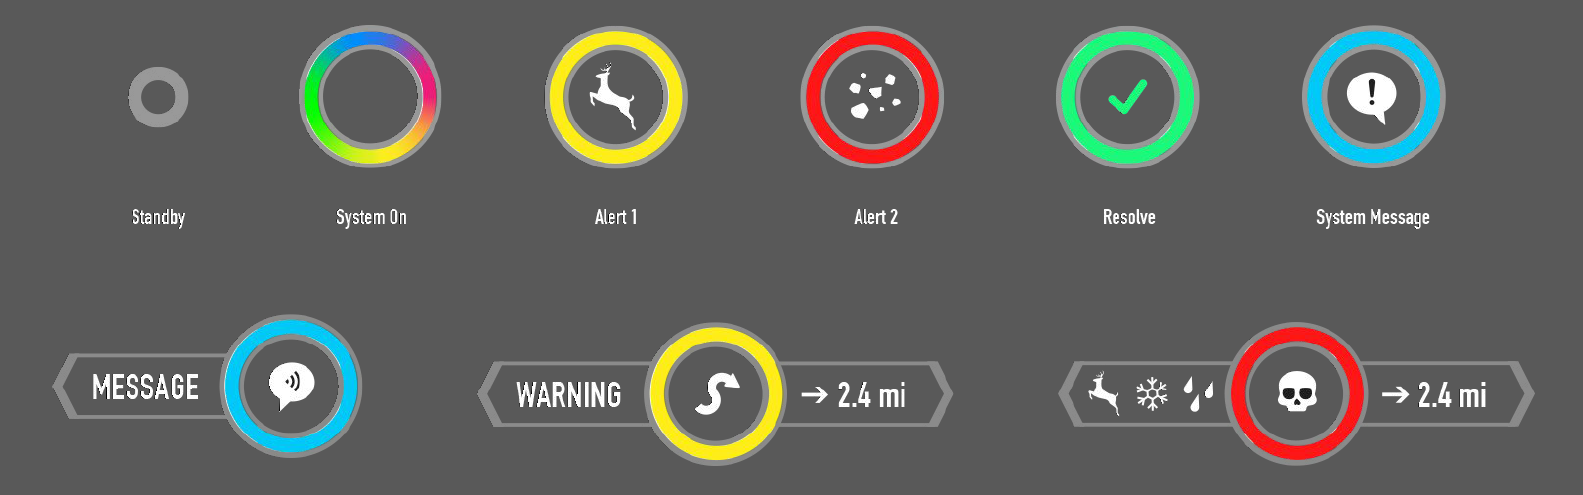
Early on, after exhaustive research and evaluation of existing HUD for both pilots and motorcyclists, we arrived at several key design guidelines. Mainly keeping the interface extremely clean, simple, and able to get out of the way easily. Our goal was to design a minimal HUD UI that was able to effectively display multiple levels of context quickly without requiring the rider's full attention.
In our design, the rider is normally presented with a simple gray circle just in the rider's periphery until an alert is being presented. Next we paired a colored circle with wings, which allowed us to show multiple levels of context quickly. Different colors indicated the severity of the alert (yellow=mild, red=sever, green=success, blue=system message).
In the center of the circle, we specified the type of hazard or alert the rider was encountering with an icon. Tertiary info such as text, numbers, or other icons were presented on the wings which slid out from the sides. After the alert was over, the wings slid back in and the colored circle shrunk back into the simple gray circle.
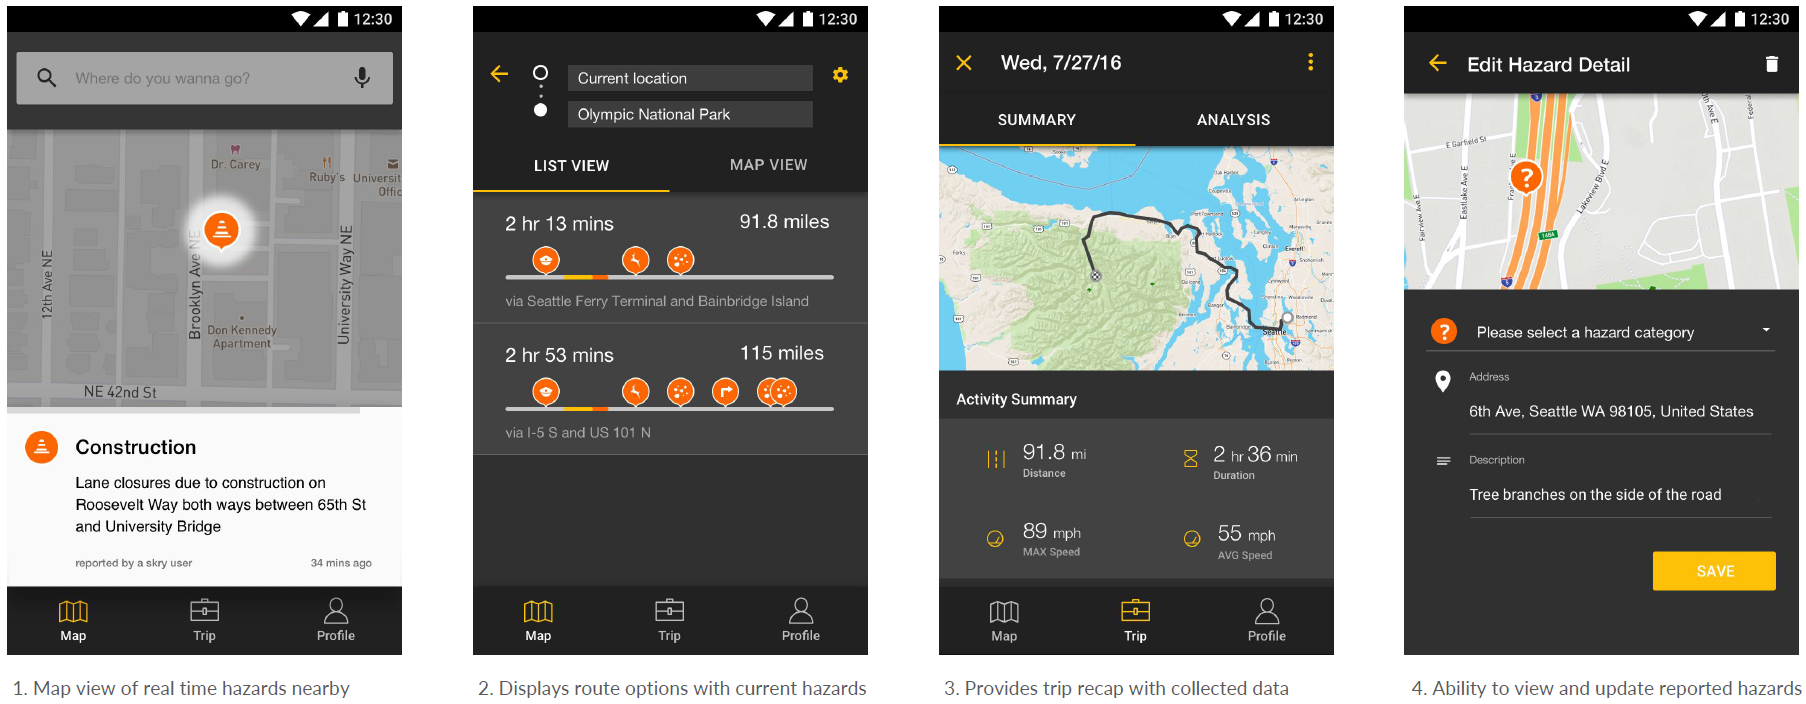
The rider interacts with the mobile app before and after the ride. It has 3 main sections: Map, Trip, and Profile. The Map section is where the rider inputs the destination and views current hazards on the road. They are able to select potential routes they might take, with the current hazards along each route shown. After they've selected a route, they will begin the navigation.
Once the ride has been completed, they will be provided with a recap of their trip. They will also be able to fix/update their reported hazards. The trip will be saved in the Trip section, so that it can be viewed at a later date. If the rider has any settings they wish to customize, such as the frequency of alerts, they will be able to make those changes in the Profile section.
The next step for our Skry concept would be building a higher-fidelity prototype that integrates with an existing smart helmet like the Skully AR-1. That way we could test the system in a motorcycle simulator. Once it has sufficiently been tested in a simulator testing, we could then move onto testing on the road, although liability concerns would have to be addressed regarding safety.
Other features that could be explored in the future are additional sensors that could be added to the bike to provide more detailed information to Skry about rider status. The current system uses sensors available on the smartphone which are limited in scope. It could also be used to send an SOS signal if the bike has been involved in an acccident and the rider is unable to call 911.